Logstash 6.2.1 Big .since-db file causes OutOfMemory

Hi Team,

I have a logstash instance that's been running for a while now but started falling over due to OutOfMemory error since yesterday.

The memory is set as -Xms1g -Xmx1g.

And it would continue to go out of memory right after every time it is restarted - in the logs, there are not many useful logs - the only line relating to the OOM is:

[2018-04-25T09:24:32,557][ERROR][logstash.inputs.metrics  ] Failed to create monitoring event {:message=>"undefined method `ephemeral_id' for nil:NilClass", :error=>"NoMethodError"}
[2018-04-25T09:24:37,813][INFO ][logstash.pipeline        ] Pipeline started succesfully {:pipeline_id=>"main", :thread=>"#<Thread:0x1ae39f8f sleep>"}
[2018-04-25T09:24:38,044][INFO ][logstash.agent           ] Pipelines running {:count=>2, :pipelines=>[".monitoring-logstash", "main"]}
[2018-04-25T09:30:30,279][ERROR][org.logstash.Logstash    ] java.lang.OutOfMemoryError: Java heap space

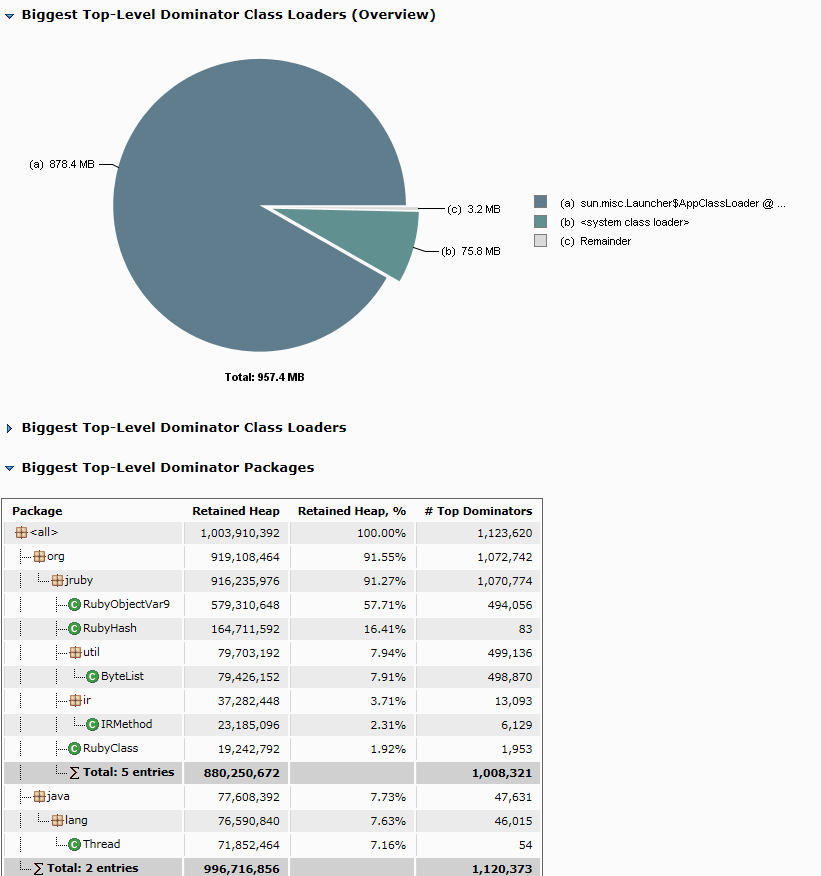
I've also looked at the heap dump but because I do not know the code base I was not able to draw a conclusion - I've attached the heap dump breakdown below for your reference.

However, upon investigation, I noticed there is one .since-db file that is quite large - it is nearly 9MB in size and has nearly 400,000 lines of content because under the logs folder there's 400,000 log files :roll_eyes:

I have tested by moving that .since-db file away, and restarting logstash and voila, logstash would not fall over anymore.

However, as soon as I put back that big .since-db file back, and restart logstash, logstash would again crash due to OOM every time it tries to boot up.

So I guess my questions are:

  • Is it normal for a .since-db file to grow that large?
  • Is it normal for logstash to go OOM (surely not :stuck_out_tongue:) due to a large .since-db file?
  • What is your advice for preventing the above?
  • I also noticed that when the large .since-db file is loaded, logstash creates a lot of "children" .since-db files of that large .since-db file that have name in the format like this: .sincedb-foobar.2064.13026.47260, and they all have zero content, they all have size 0 - what are these files?

Below is the relevant file input bit in my logstash.conf:

  file {
    sincedb_path          => "/var/tmp/.sincedb-foobar"
    max_open_files        => 10000
    close_older           => 60
    ignore_older          => 1296000 # 15 days
    path                  => "/foo/bar/*"
    type                  => "foobar"
    start_position        => "beginning"

    codec => multiline {
      patterns_dir        => ["${LS_PATTERNS}"]
      pattern             => "^%{TIMESTAMP_ISO8601}"
      negate              => "true"
      what                => "previous"
      auto_flush_interval => 60
      max_lines           => 5000
    }
  }

So I have done some further tests by changing max_open_files from 10,000 to a really small number 10.

This did not help and just served to delay the inevitable - logstash stayed alive for a bit longer but then OOM'd eventually so looks like it's not the number of files open that is causing the OOM but maybe logstash is trying to build some sort of data structure for the population of files that is getting out of control?

@ld_pvl

Yes Logstash is building an internal data structure from the contents in the big sincedb file. But there are other data structures that will contribute to OOM with the config given.

Are you really tailing 400 000 files? If not then you are reading them - how come so many in the monitored folder?

Please explain your use case in detail I might be able to make some suggestions. I looked at your posting history and you sound like you know your way around the Elastic Stack but I could not see a definitive outline of your Logstash use case.

We have just released version 4.1.0 of the file input. This is the changelog.

Some new settings and behaviours may be useful to you but I want to understand what you are doing before I can be confident in what I recommend.

If by tailing you mean not reading files from the beginning then looks like I am reading them - did I understand correctly?

But the setting start_position is only applied on first contact, so does this have any effect at all given that my .sincedb should have references to all the files already? Quoting the docs:

This option only modifies "first contact" situations where a file is new and not seen before, i.e. files that don’t have a current position recorded in a sincedb file read by Logstash. If a file has already been seen before, this option has no effect and the position recorded in the sincedb file will be used.

I need to clarify one thing as well - LS has been running fine on this host for a while until .sincedb got large. LS did not go OOM when I initially turned it on on this host. In fact it runs ok if I delete the .sincedb file and start from scratch even though there's still 500,000 log files on the host that it needs to churn through.

Only when .sincedb gets to a certain size then LS starts going OOM.

This due to various services running on the host and is out of my control.

My use case is:

  • We opted to deploy logstash instead of filebeat on each of our hosts (due to misc reasons) to gather and parse logs.

  • On a handful of our hosts, one service might have created numerous log files (up to 1 million plus) under a folder tree which I monitor as a whole - this is out of my control. One interesting thing I noticed, although in the logstash.conf I've set to ignore files older than 15 days but inodes for files older than 15 days still seem to be added into .sincedb so I'm guessing .sincedb gets populated in a different "code flow".

  • Another scenario is where there are not many files under a folder but they get rolled a lot so .sincedb file just keeps growing because there is no automatic clean up for the content inside .sincedb - looks like there is already an open ticket for this.

I did some performance testing when I hit this OOM issue. When .sincedb has around 500,000 lines, roughly 9MB in size, the minimum Logstash Xmx I can set is around 2.5GB before it goes OOM.

I don't really want to just throw more RAM in the way of LS because this is just delaying the inevitable.

I'm not sure if this can be considered a memory leak or an implementation aspect to be improved but from my observations I see that a 9MB metadata file .sincedb seems to be causing LS to build up something internally up to 2.5GB which then can cause LS to go OOM.

I thought it was because in logstash.conf I was opening too many open files but as reported in the previous reply even changing it to a small number did not seem to affect the behaviour of LS.

When .sincedb is large and LS Xmx is set to a low value, from a user perspective, I don't really want LS to go OOM but rather to process things slower meaning maybe cycle through the list in .sincedb because it is quite hard to figure out in what conditions OOM is gonna happen.

Thanks for that info. That issue you linked to is in the main LS repo and not the file inputs repo - I am tracking this same issue.

In your use case you will not be able to use the new Read mode, this is OK.

In 4.1.0 there is a new setting called sincedb_clean_after that removes sincedb records that have not seen any activity in N days, the default is 14 days. This removes them from memory and on disk.

However this setting is not a silver bullet.
In v 4.1.0 the sincedb record on disk has two extra values the last_active timestamp and the last_seen_path, but when you start LS for the first time after the plugin upgrade it will read the old sincedb file that does not have these extra values and must use less information to decide how to match the discovered file with a sincedb record entry - it will use the inode only on first run. This is not fool proof because it can match an old content inode sincedb entry with a new content inode as discovered. Later, on LS restart it can use the path as well as the inode during matching.

One strategy to manually edit the sincedb file is to find the inodes of the currently active files. This will take a while but it can be done. This find /var/whatever -maxdepth 255 -type f -printf "%i %p\n" > ~/current-inodes or similar, then use whatever tools available to you to compare and remove all sincedb records that have no corresponding entry in the current-inodes list.

Another strategy, less precise, is to start logstash with max_open_files => 1 and then stop it fairly quickly, this will process one file but it will write the full sincedb in the new format and any entries that were not mapped to current discovered files will not have a path as the sixth value - these can be deleted manually, otherwise it will take 14 days for them to be auto-removed.

I hope that this is helpful.

Thanks a lot of this reply.

I was indeed thinking about writing something that would do a clean up for .sincedb but 4.1.0's new features sound sufficient.

I will do some testing and get back.

Reporting back :vulcan_salute:

LS 6.2.1 comes with file input plugin 4.0.3 so I manually updated it to 4.1.0 using logstash-plugin script however it threw me this error:

Problems loading a plugin with {:type=>"input", :name=>"file", :path=>"logstash/inputs/file", :error_message=>"No such file or directory - JAR_VERSION", :error_class=>Errno::ENOENT, :error_backtrace=>["org/jruby/RubyIO.java:3600:in `read'"

Although I can clearly see JAR_VERSION was in there and logstash-plugin list --verbose also reports the right plugin version. Tried several ways to resolve this issue but then gave up.

I then installed latest LS 6.2.4 version which comes with file input 4.0.5 and then I updated it but this time it updated to 4.1.1 - not sure if it was just the timing and 4.1.1 was just released, but this time LS runs fine.

Even with the original old big .sincedb file in place, LS 6.2.4 seems to run without problems and memory is managed much better. Memory usage hovers only around 50% of the total of 1GB and LS no longer struggles to do event processing. So whatever improvements that were done between 6.2.1 and 6.2.4 made quite a difference in terms of stability :+1: because 6.2.1 would go OOM right after pipeline starts running. But I'll let the new 6.2.4 instance run over night anyway to see if any problems come up later.

How do I know when is the correct time to do a restart?

Apologies, 4.1.0 had errors. I just fixed and released 4.1.1. :smile: Timing.

Glad to hear its better. One big improvement is the way the sincedb records are persisted. Before it would build one huge string and write that, now it builds one record at a time as a string and writes that so the memory consumption is lower for each sincedb write.

1 Like

I was talking to @fbaligand (one of our Community Maintainers), he has a similar use case to you and has done a great job feeding back on the 4.1.X changes about the sincedb cleaning issue.

How do I know when is the correct time to do a restart.

This depends on the least active file in your monitored set and how long it takes from LS start-up time until it has had more content added AND that content is seen in Kibana. Only then will a shutdown write a sincedb file with up-to-date timestamps for all matched (by inode) entries. Matching means a watched_file is linked to a sincedb record. All unmatched sincedb records will have a timestamp that is the time that the sincedb record was converted from a v1 to a v2 format.

We are still developing the rules-of-thumb.

4.1.1 has this striped read feature where you can read horizontally across all files in stripes, this ensures that all changing files have had some activity logged against them. Perhaps this is useful?

If a file has not grown or shrunk in 14 days (measured from first run of 4.1.1 or since the last seen change) the sincedb record will be cleaned - if the file then changes, it will be reread from scratch.

Hope this helps.

1 Like

Thanks a lot - this helps a great deal.

Hi,

Had some time to continue testing today.

So I decided to clean up all sincedb's and see how the new file input (actually I'm using 4.1.2 now) plugin behaves when there are log of log files under a folder to begin with, from scratch.

And I noticed that even after running a while logstash is not sending any logs that are under the folder with a lot of log files and the sincedb for that folder is empty whereas for other folders with less log files logstash is sending events normally and the sincedb files for those folders are populated ok.

As you mentioned, it should build a record at a time and write it to the sincedb but doesn't look like that that is being done - am I missing something?

FYI, there are some strange messages but not sure if related, eg:

[2018-05-04T09:52:50,706][INFO ][filewatch.tailmode.handlers.grow] buffer_extract: a delimiter can't be found in current chunk, maybe there are no more delimiters or the delimiter is incorrect or the text before the delimiter, a 'line', is very large, if this message is logged often try increasing the `file_chunk_size` setting. {"delimiter"=>"\n", "read_position"=>827326, "bytes_read_count"=>66, "last_known_file_size"=>827392, "file_path"=>"/foo/bar/my.log"}

sincedb file persistence can be delayed if the files being read are very big.

You could experiment with the striped or breadth-first feature. Unfortunately the online doc for the file input still shows the 4.0.5 docs. Heres the raw asciicdoc
By changing file_chunk_size, file_chunk_count and max_open_files the sincedb persistence can keep pace with the processing.
Try

    file_chunk_size => 1048576 # 1MB
    file_chunk_count => 1
    max_open_files => 100 # 100 buffers with at most 1MB in play.

These setting mean that 1MB will be read once from 10 files then the sincedb can be written and the the next 1MB is read from each file and so on.

Let me know if this helps.

Most of the files are not big, they are small. It's just that there are tons of them.

But maybe there are some big ones and because file_chunk_count default value is 4611686018427387903 which is effectively read everything to EOL - maybe it's stuck at one or two big files.

Let me try.

I hope that you are writing to different physical files when using multiple file inputs in the same config.

Sorry, I didn't quite get it - could you clarify writing what exactly to different physical files?

If you mean for each file input I use different sincedb or not then yep, I do, eg:

  file {
	sincedb_path          => "/example/.sincedb-foo"
	path                  => "/foo/*/*.log"   # under foo subfolders there are a lot of log files and none are being discovered
	# etc
  }

  file {
	sincedb_path          => "/example/.sincedb-bar"
	path                  => "/bar/*/*.log"  # under bar there are not as many files and are being published ok
	# etc
  }
1 Like

About the lack of activity in the many files input.

Can you run a second LS with just the one input and turn on debug logging? I have put (too) many debug log statements because the code has changed a lot.
You don't have to run LS for very long, 3 - 5 minutes. Note: a lot of lines will be written to the LS logs. I need to see these to figure out what is happening. You may need to sanitize them - paths are written a lot.

I played with file_chunk_size, file_chunk_count and max_open_files - didn't seem to help.

I will turn on debug as you suggested.

I misread your reply because I meant try striped reading if your files are being processed but the sincedb is not being written (at all or often) but this is not the problem you described.

Yeah, for the problem as described I would love to see the logs.

Yeah, looks like I get what it's doing now.

I've been watching the logs, and looks like logstash is cycling and discovering each log file approximately every second - I think it's because the discovery interval by default is 1 second.

And then it is ignoring some old files cos I configured it to.

But because there are a lot of files (500,000) - it's gonna take probably days :smile:

I keep seeing blocks like the below appearing one after another every second for each discovered file:

[2018-05-04T12:51:19,769][DEBUG][filewatch.discoverer     ] Discoverer found file, path: /some/file.log
[2018-05-04T12:51:19,769][DEBUG][filewatch.discoverer     ] Discoverer discover_files: /foo/bar*.log: new: /some/file.log (exclude is [])
[2018-05-04T12:51:19,769][DEBUG][filewatch.discoverer     ] Discoverer discover_files: /some/file.log: skipping because it was last modified more than 1296000 seconds ago
[2018-05-04T12:51:19,793][DEBUG][filewatch.sincedbcollection] associate: finding: /some/file.log
[2018-05-04T12:51:19,793][DEBUG][filewatch.sincedbcollection] find for path: /some/file.log, found: 'false'

I could double check but I'm pretty sure in the old file input version things got discovered quicker (with the same logstash.conf - I didn't change any config).

Ok, so something is happening at least. However Im concerned that it seems to be one file per scan_interval. I would need more logs to confirm this. The logging timestamp would be seconds not milliseconds apart.

One thing I need to ask - is the 500,000 files a pretty much fixed set?

An explanation of the interplay between scan_interval and discover_interval is really necessary, Its really about loop counts. There is a discover, process loop, scan_interval is a sleep setting - the loop sleeps for default 1 second, then for every discover_interval times through the loop a discovery is run.
Now if you don't need to discover more files but there is a lot of work to do then there is no point in sleeping much or running a discovery often so to achieve that one can set the scan_interval to 0.01 (sleep for 10ms) and a discover_interval to 90000 (15 minutes * 60 / 0.01ms). This means more cycles allocated to file processing.

However, the above only applies to your setup after the initial 500,000 files have been fully discovered and as you see, this takes time.

As an improvement, I need to change the code to drip feed globbed files into the actual discovery handler. One approach would be to use the max_open_files setting to "feed" fewer files into the discovery handler.

What timezone are you in?
How well do you know Ruby?
If I gave you code changes, could you edit the the files I would indicate with confidence?