Logstash and Kafka Input

Hello Folks,

I have a query about an observed side-effect of my Logstash kafka-input configuration. It is not directly apparent to me what the problem is and hope people with deep expertise can help me out here.

We have a decent amount of EPS about 10K. Occasionally it fluctuates between 10K to 20K and worst case goes above 30K.

My node setup is as below:

  1. 9 Nodes of Kafka
  2. 18 Nodes of Logstash
  3. 18 Data Nodes of Elasticsearch, 3 Master Nodes, 9 Ingest Nodes

There are several topics in the Kafka cluster, about 20-25.

Each Logstash node has below configuration of Kafka input parameters:

logstast-kafka-input-config

Besides that following three params are set in pipeline configuration:

pipeline.workers: 32
pipeline.batch.size: 1024
pipeline.batch.delay: 10

There is a single pipeline processing all events for each LS node.

The kafka topics each have below configuration:

kafka_topic_config_params

Each topic has 540 partitions and each LS node Kafka input has 30 consumer-threads, so 30x18=540 one for each partition. When not under heavy pressure, I see that it can reach expected EPS even for single consumer thread (i.e. 18 total, but we leave it at 540 as some topics get heavy ingest depending on traffic conditions)

Now to the issue being faced. As noted there are several Kafka topics, two of them have very heavy ingest flow about 4-5K EPS for first and 2-6K EPS for the second.

When topic 1 is under heavy load (defined as lag of 4-5M messages) but no issue on ES ingestion, topic 2 EPS shows spikes from almost no ingest to expected ingest value when the lag in Kafka for topic 2 is "normal" (several K EPS).

Under normal conditions on Topic 1 (Lag of several K records), Topic 2 normal EPS looks like below, it is almost always above the threshold of 1000 EPS:

Topic 1 under heavy lag (2-5 M records) is still able to ingest well and looks like below:

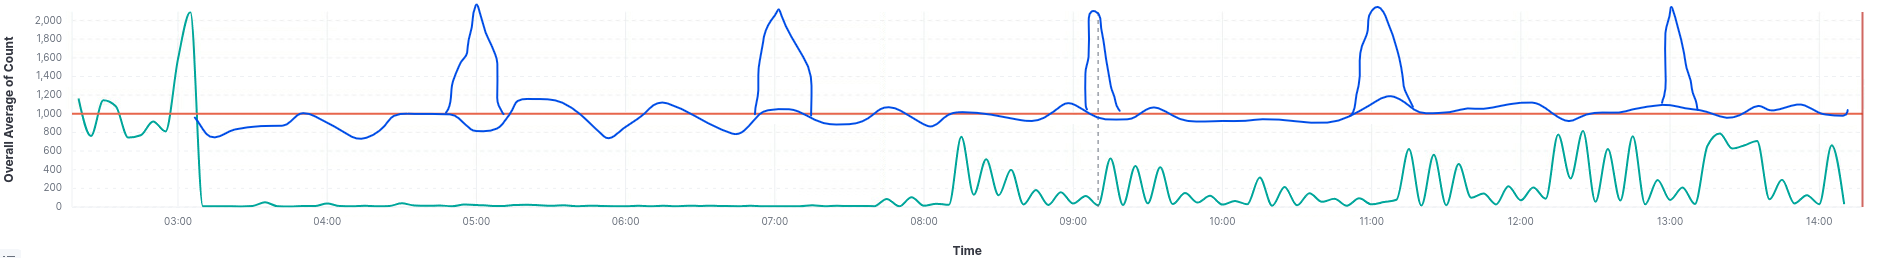
Now when we have an ES outage (may be due to a heavy spike in traffic), this is what happens to Topic 1 pattern.

The hand-drawn blue line is how the traffic should look like as Kafka is buffering it. "retention.ms" is 3 days, and it is able to reach "normal" lag numbers fairly quickly (within few hours or at most a day).

The missing data/records never make it to Elasticsearch but I get those intermediate spikes with tails as if LS starts reading from new position every 1 hour or so.

Topic 2 suffers similarly during this as below:

Apologies for the ugly hand-drawn blue lines in above image.

None of the other topics suffer like this, data/records from them are recovered fully with same patterns in EPS trends as on "normal" days.

Could those of you who are running large clusters with Kafka as front buffering component suggest what I may be doing incorrectly here?, and how to debug this to find what component or configuration is causing this?

We are monitoring JMX metrics from Kafka and it is stable during these scenarios. There is plenty of storage for ES and heap is mostly at 50% full, only one or two nodes of ES go out of service due to sudden traffic spike. Even if I restart the ES cluster, while recovering all primary indices, ES cluster is able to reach ingest rates of 20-25K and sustained > 10K almost always. After replicas have been recovered, ingestion rates remain at sustained 10-15K as normal.

ELK is on version 7.17.9 and we plan to move to 7.17.14 soon. Kafka is at 6.0.1

Any guidance would be much appreciated.

Hello,

It is not clear what your issue really is and if it is related to Logstash/Elasticsearch or is a Kafka Issues.

What is the source of the graphics you shared? What do they mean? Are those events indexed to Elasticsearch? Processed by Logstash? Or just events on your Kafka topics?

It is not clear what these graphics really mean, can you provide more context?

From what I understand you have something like this:

Source data -> Kafka -> Logstash -> Elasticsearch

And sometimes when you are under heavy traffic you lose data in Elasticsearch even when using Kafka as a buffer, is this correct?

Also, by Kafka is at 6.0.1 you mean that you are using the Confluent Platform Kafka, right? Is it as a SaaS or self-hosted?

You are using range as the partition_assignment_strategy, so this is not exactly true as the partitions are not divided evenly, some consumers may have more partitions assigned to them.

Not sure if this can cause any issue because I'm not sure what is the real issue here.

Is this per topic or overall? 18 Logstash nodes for just 10k EPS looks like a lot of those can be underutilized, can you share your entire logstash configuration?

Hello,

Thank you for your reply.

These are trend graphs of EPS per Kafka topic when ingested into Elasticsearch.

That is correct.

Right, my issue is while data for other topics seems to get ingested fine, the ones with heavy input (or more lag in Kafka) seem to get affected.

Yes, I am using CP Kafka, it will be 2.6.x release. This is all self-hosted on Linux and Docker.

In the monitoring solution, I can see that each consumer group (dedicated to one topic) has 540 members, which are all stable, so between LS nodes they are evenly distributed and on Kafka side also.

What I am trying to say is, the issue of lost events is only occurring when Topic 1 has a lot of lag (about 4-5 M records lagging). Now while the ingestion of all those records completes without logs, when that lag is there it affects smooth ingestion of records of Topic 2 (which is the next highest lagging topic).

Also as I am not keying the records in Kafka, I expect the range strategy and auto_offset_reset=earliest to simple pop-off each records as it was added to the queue in the same order that it was added.

What seems to happen though is that LS is pulling data with some periodicity (where the spikes are) as it pops the records from Kafka.

Again, this behavior is not seen when there is no heavy lag. So I am guessing it has something to do with the combination of my Kafka and LS configuration. I am looking to understand which parameter might be affecting this.

This is overall EPS, as I said it can burst up to 35K but usually averages between 10-15K. BTW, these nodes are not their own independent machines, they are running in containers on VMs. Each VM has two nodes of LS and two nodes of ES, each LS node has 8GB assigned and ES nodes 32GB. Each VM is about 80% utilized. There are other services also but I have checked that they do not impact LS and ES, we have carefully isolated resources for each service.

Can you share your logstash configuration? You didn't share it, also share your logstash.yml configuration.

This would help to understand what Logstash is doing.

Hello Leandro, I will share the config soon, it is pretty standard except the parameters already shared above. I am signing off for now, as It is pretty late in the night here. I will check back in tomorrow.

My Logstash configuration is as below, it is super basic, nothing complicated.

# logstash.yml
http.host: "0.0.0.0"
#path.config: /usr/share/logstash/pipeline/*.conf
pipeline.ecs_compatibility: disabled
pipeline.ordered: false
pipeline.java_execution: true
pipeline.workers: 32
pipeline.batch.size: 1024
pipeline.batch.delay: 10
config.reload.automatic: true
config.reload.interval: 30s

# pipelines.yml
- pipeline.id: main
  path.config: "/usr/share/logstash/pipeline"

# 00-input-kafka-foo.conf
# foo is name of kafka topic, here "test"

input {
    kafka {
        # servers
        bootstrap_servers => "broker-1:9092, ..., broker-9:9092"

        # topic to read from
        topics => [ "test" ]

        # codec
        codec => "json"

        # unique id
        client_id => "logstash-test"
        group_id => "group-logstash-test"

        # tags
        tags => [ "kafka-input-test" ]

        # auto commit parameters
        enable_auto_commit => true
        auto_commit_interval_ms => 10000
        auto_offset_reset => "earliest"

        # performance parameters
        max_poll_records => 512
        fetch_max_bytes => 52428800
        fetch_max_wait_ms => 1000
        session_timeout_ms => 30000
        max_poll_interval_ms => 1200000
        partition_assignment_strategy => range

        # n_topic_paritions/n_logstash_node or 1
        consumer_threads => 30

        # add kafka specific metadata
        decorate_events => "basic"
    }
}

# bunch of ordered files (01-98) with filters for parsing/enrichment
filter {
        if ("kafka-input-test" in [tags]) {
              # do the thing ...
        }
}

# 99-elasticsearch-output.conf
output {
        if ("kafka-input-test" in [tags]) {
            elasticsearch {
                hosts => ["es1:9200", ..., "es18:9200" ]
                sniffing => true
                index => "logs-test-%{+YYYY.MM.dd}" # datastream
                pipeline => "logs-test"
                action => "create"
                user => 'elastic'
                password => '...'
                #pool_max_per_route => 1024
                #http_compression => true
                validate_after_inactivity => 10
           }
       }
}

I don't see anything that would lead to this error, no idea what is happening.

How are you setting the @timestamp of your events? Are you using any date from your documents or you are using the default @timestamp generated by Logstash?

You didn't share it, but if you are using the default @timestamp generated by Logstash you will have some gaps if Logstash is backing off on the input, but the data will be indexed with a later data.

Also, do you have anything in Logstash logs when you have this situation?

Since you have two high rate topics, are you using exclusive logstash just for them? I would set up a couple of Logstash just for them if you are not.

Thanks for the recommendations, I will try them out.

Regarding @timestamp, in some cases I do use the one generated by logstash, but in most places I am using the one that comes from source normalized to UTC. I have some variation there but that does not seem to explain this as this issue occurs only during heavy load. If the data gets indexed with a later date, I would see a paucity of logs at a later time, but total count will not get affected. Here the total count is less than expected from past patterns.

I will try to see if I can use dedicated nodes for high rate topics. I am also trying out round-robin as a partition assignment strategy to see if that makes any difference. Rest of the kafka-input specific parameters I am maintaining as in documentation defaults.

Will report back once I learn more. Thanks much for your help!

This topic was automatically closed 28 days after the last reply. New replies are no longer allowed.