Logstash “bad_certificate” Handshake Failure on port 5055

Environment

Item Version / Detail
Security Onion 2.4.160
Host role so-manager (10.10.0.13) Standalone Network install on Rocky Linux 9
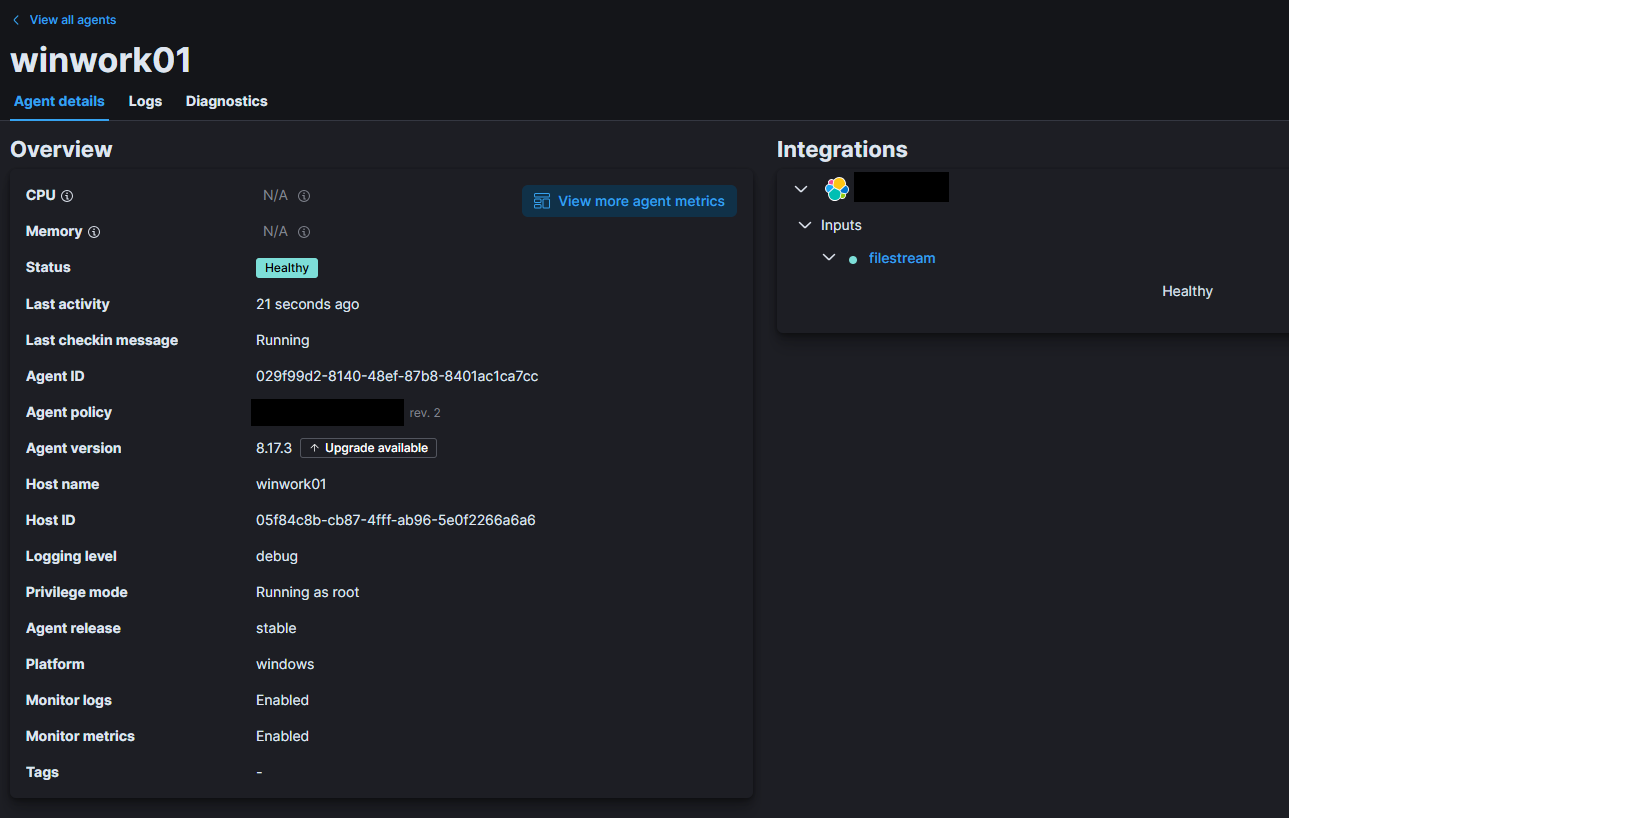
Elastic Agent endpoint Windows host winwork01 (10.10.0.4)
Beats/Elastic-Agent port 5055/TCP (default from install)

Issue Summary

I've developed a custom integration that collects logs that should be picked up by Elastic Agent and forwarded. I see the events being published from my Windows host, but they seem to be getting stuck inside Logstash. Even after trying to disable client-certificate verification and regenerating the CA, Logstash does not seem to forward events to my Fleet Server/Elasticsearch/Kibana. I get the following error inside the Logstash Docker container:

[2025-07-09T14:34:51,454][INFO ][org.logstash.beats.BeatsHandler] [local: 172.17.1.29:5055, remote: 10.10.0.4:55759] Handling exception: io.netty.handler.codec.DecoderException: javax.net.ssl.SSLHandshakeException: Received fatal alert: bad_certificate (caused by: javax.net.ssl.SSLHandshakeException: Received fatal alert: bad_certificate)
[2025-07-09T14:34:51,455][WARN ][io.netty.channel.DefaultChannelPipeline] An exceptionCaught() event was fired, and it reached at the tail of the pipeline. It usually means the last handler in the pipeline did not handle the exception.
io.netty.handler.codec.DecoderException: javax.net.ssl.SSLHandshakeException: Received fatal alert: bad_certificate
        at io.netty.handler.codec.ByteToMessageDecoder.callDecode(ByteToMessageDecoder.java:500) ~[netty-codec-4.1.118.Final.jar:4.1.118.Final]
        at io.netty.handler.codec.ByteToMessageDecoder.channelRead(ByteToMessageDecoder.java:290) ~[netty-codec-4.1.118.Final.jar:4.1.118.Final]
        at io.netty.channel.AbstractChannelHandlerContext.invokeChannelRead(AbstractChannelHandlerContext.java:444) ~[netty-transport-4.1.118.Final.jar:4.1.118.Final]
        at io.netty.channel.AbstractChannelHandlerContext.invokeChannelRead(AbstractChannelHandlerContext.java:420) ~[netty-transport-4.1.118.Final.jar:4.1.118.Final]
        at io.netty.channel.AbstractChannelHandlerContext.fireChannelRead(AbstractChannelHandlerContext.java:412) ~[netty-transport-4.1.118.Final.jar:4.1.118.Final]
        at io.netty.channel.DefaultChannelPipeline$HeadContext.channelRead(DefaultChannelPipeline.java:1357) ~[netty-transport-4.1.118.Final.jar:4.1.118.Final]
        at io.netty.channel.AbstractChannelHandlerContext.invokeChannelRead(AbstractChannelHandlerContext.java:440) ~[netty-transport-4.1.118.Final.jar:4.1.118.Final]
        at io.netty.channel.AbstractChannelHandlerContext.invokeChannelRead(AbstractChannelHandlerContext.java:420) ~[netty-transport-4.1.118.Final.jar:4.1.118.Final]
        at io.netty.channel.DefaultChannelPipeline.fireChannelRead(DefaultChannelPipeline.java:868) ~[netty-transport-4.1.118.Final.jar:4.1.118.Final]
        at io.netty.channel.nio.AbstractNioByteChannel$NioByteUnsafe.read(AbstractNioByteChannel.java:166) ~[netty-transport-4.1.118.Final.jar:4.1.118.Final]
        at io.netty.channel.nio.NioEventLoop.processSelectedKey(NioEventLoop.java:796) ~[netty-transport-4.1.118.Final.jar:4.1.118.Final]
        at io.netty.channel.nio.NioEventLoop.processSelectedKeysOptimized(NioEventLoop.java:732) ~[netty-transport-4.1.118.Final.jar:4.1.118.Final]
        at io.netty.channel.nio.NioEventLoop.processSelectedKeys(NioEventLoop.java:658) ~[netty-transport-4.1.118.Final.jar:4.1.118.Final]
        at io.netty.channel.nio.NioEventLoop.run(NioEventLoop.java:562) ~[netty-transport-4.1.118.Final.jar:4.1.118.Final]
        at io.netty.util.concurrent.SingleThreadEventExecutor$4.run(SingleThreadEventExecutor.java:998) ~[netty-common-4.1.118.Final.jar:4.1.118.Final]
        at io.netty.util.internal.ThreadExecutorMap$2.run(ThreadExecutorMap.java:74) ~[netty-common-4.1.118.Final.jar:4.1.118.Final]
        at java.lang.Thread.run(Thread.java:1583) ~[?:?]
Caused by: javax.net.ssl.SSLHandshakeException: Received fatal alert: bad_certificate
        at sun.security.ssl.Alert.createSSLException(Alert.java:130) ~[?:?]
        at sun.security.ssl.Alert.createSSLException(Alert.java:117) ~[?:?]
        at sun.security.ssl.TransportContext.fatal(TransportContext.java:370) ~[?:?]
        at sun.security.ssl.Alert$AlertConsumer.consume(Alert.java:287) ~[?:?]
        at sun.security.ssl.TransportContext.dispatch(TransportContext.java:209) ~[?:?]
        at sun.security.ssl.SSLTransport.decode(SSLTransport.java:172) ~[?:?]
        at sun.security.ssl.SSLEngineImpl.decode(SSLEngineImpl.java:736) ~[?:?]
        at sun.security.ssl.SSLEngineImpl.readRecord(SSLEngineImpl.java:691) ~[?:?]
        at sun.security.ssl.SSLEngineImpl.unwrap(SSLEngineImpl.java:506) ~[?:?]
        at sun.security.ssl.SSLEngineImpl.unwrap(SSLEngineImpl.java:482) ~[?:?]
        at javax.net.ssl.SSLEngine.unwrap(SSLEngine.java:679) ~[?:?]
        at io.netty.handler.ssl.SslHandler$SslEngineType$3.unwrap(SslHandler.java:309) ~[netty-handler-4.1.118.Final.jar:4.1.118.Final]
        at io.netty.handler.ssl.SslHandler.unwrap(SslHandler.java:1485) ~[netty-handler-4.1.118.Final.jar:4.1.118.Final]
        at io.netty.handler.ssl.SslHandler.decodeJdkCompatible(SslHandler.java:1378) ~[netty-handler-4.1.118.Final.jar:4.1.118.Final]
        at io.netty.handler.ssl.SslHandler.decode(SslHandler.java:1427) ~[netty-handler-4.1.118.Final.jar:4.1.118.Final]
        at io.netty.handler.codec.ByteToMessageDecoder.decodeRemovalReentryProtection(ByteToMessageDecoder.java:530) ~[netty-codec-4.1.118.Final.jar:4.1.118.Final]
        at io.netty.handler.codec.ByteToMessageDecoder.callDecode(ByteToMessageDecoder.java:469) ~[netty-codec-4.1.118.Final.jar:4.1.118.Final]
        ... 16 more

This prevents any data from reaching Elasticsearch/Kibana.


Things I've Tried...

  1. Created custom Beats input

    • Created: /opt/so/saltstack/local/salt/logstash/pipelines/config/custom/0012_input_elastic_agent_noauth.conf
    • Key changes:
      ssl_verify_mode => "none"
      # ssl_certificate_authorities removed
      
  2. Updated pipeline list (replaced so/0012_input_elastic_agent.conf.jinja )

    • SOC → Administration → Configuration → logstash → defined_pipelines → manager:
      so/0011_input_endgame.conf
      custom/0012_input_elastic_agent_noauth.conf
      so/0013_input_lumberjack_fleet.conf
      so/9999_output_redis.conf.jinja
      
    • Clicked Synchronize Grid (Salt redeployed & restarted Logstash).
  3. Tried to regenerate certificates

    sudo rm -f /etc/pki/*ssl*.{crt,key}
    sudo salt-call state.apply ssl,nginx,logstash
    
    
  4. Downloaded fresh Elastic-Agent installer from SOC → Downloads.

    • Reinstalled agent on winwork01

Note that this is a lab environment and I'm not concerned about the security implications of disabling SSL verification if I have to. I just need to get the events forwarded somehow and I'm at my wits end.

Any ideas on what I'm doing wrong here?

What is sending data to Logstash? Elastic Agent?

Please share both the logstash input configuration and the Elastic Agent output configuration.

Thank you for the fast response @leandrojmp.

Correct, Elastic Agent should be sending the data to Logstash.

Logstash Input (/opt/so/saltstack/local/salt/logstash/pipelines/config/custom/0012_input_elastic_agent_noauth.conf)

input {
  elastic_agent {
    port => 5055
    tags => [ "elastic-agent", "input-{{ GLOBALS.hostname }}" ]
    ssl => true
    ssl_certificate => "/usr/share/logstash/elasticfleet-logstash.crt"
    ssl_key => "/usr/share/logstash/elasticfleet-logstash.key"
    ssl_verify_mode => "none"
    ecs_compatibility => v8
  }
}
filter {
if ![metadata] {
  mutate {
    rename => {"@metadata" => "metadata"}
  }
}
}

custombeat-endpoints Agent Policy (sanitized)

id: b01d59d7-f1fa-4dc6-8c0f-3598c0003391
revision: 2
outputs:
  so-manager_logstash:
    type: logstash
    hosts:
      - '34.67.36.189:5055'
      - 'so-manager:5055'
      - '10.10.0.13:5055'
    ssl:
      certificate: |-
        -----BEGIN CERTIFICATE-----
        MIIGEjCCA/qgAwIBAgIUa5h1LcJtpuKFOi9otYXbeDmXEBYwDQYJKoZIhvcNAQEL
	...
        -----END CERTIFICATE-----
      key: |-
        -----BEGIN PRIVATE KEY-----
        MIIJQgIBADANBgkqhkiG9w0BAQEFAASCCSwwggkoAgEAAoICAQDAeKdR7hoNX4bM
        ...
        -----END PRIVATE KEY-----
      certificate_authorities:
        - |-
          -----BEGIN CERTIFICATE-----
          MIIFhTCCA22gAwIBAgIUcbxx8bwByRN9rykWinu4zdXj/DEwDQYJKoZIhvcNAQEL
          ...
          -----END CERTIFICATE-----
fleet:
  hosts:
    - 'https://34.67.36.189:8220'
    - 'https://so-manager:8220'
    - 'https://10.10.0.13:8220'
output_permissions: {}
agent:
  download:
    sourceURI: 'http://10.128.0.10:8443/artifacts/'
  monitoring:
    enabled: true
    use_output: so-manager_logstash
    logs: true
    metrics: true
    traces: true
    namespace: default
  features: {}
  protection:
    enabled: false
    uninstall_token_hash: A3faMXbamGVUu+uUABlmOJiRDmKWj8Us2rMv69+vywQ=
    signing_key: >-
      MFkwEwYHKoZIzj0CAQYIKoZIzj0DAQcDQgAErO7covVCYRe7gZlFSfL6Skbn3nRzMdNKcsf4PS5+JkvJT03nZJVsbdGIdX+6M346hgWaGydrel6sMJBbI8OD+w==
inputs:
  - id: filestream-custombeat-aa8a745b-89c6-4862-be1e-ff52a6c76151
    name: custombeat
    revision: 1
    type: filestream
    use_output: so-manager_logstash
    meta:
      package:
        name: custombeat
        version: 0.0.1
    data_stream:
      namespace: default
    package_policy_id: aa8a745b-89c6-4862-be1e-ff52a6c76151
    streams:
      - id: custombeat-users
        type: filestream
        data_stream:
          dataset: custombeat.users
          type: logs
        read_from_head: true
        paths:
          - 'C:\ProgramData\Elastic\Beats\Custombeat\data\*_users.json'
        exclude_files:
          - \\.zip$
        parsers:
          - ndjson:
              target: ''
              overwrite_keys: true
              add_error_key: true
              expand_keys: true
        close_inactive: 2h
        pipeline: ''
signed:
  data: >-
    eyJp...
  signature: >-
    MEYCIQDruUFMz...
secret_references: []
namespaces: []

Note that 10.128.0.10 is my management interface that points to my external IP of 34.67.36.189 via the url_base setting. This is supposed to be solely for accessing the SOC web UI over the internet since my lab is in Google Cloud.

My intent is for all the lab traffic to go through the 10.10.0.0/24 subnet.

@RyanW

Perhaps take a look at the docs that the logstash ssl key requires specific format … for elastic agent input?

SSL key to use. This key must be in the PKCS8 format and PEM encoded. You can use the openssl pkcs8 command to complete the conversion. For example, the command to convert a PEM encoded PKCS1 private key to a PEM encoded, non-encrypted PKCS8 key is:

openssl pkcs8 -inform PEM -in path/to/logstash.key -topk8 -nocrypt -outform PEM -out path/to/logstash.pkcs8.key

@stephenb

I see that the key already exists in both formats from the following output:

-rw-r-----. 1 logstash      socore        3268 Jul  9 01:52 /etc/pki/elasticfleet-logstash.key
-rw-------. 1 root          root          3268 Jul  9 01:52 /etc/pki/elasticfleet-logstash.p8

But it is curious to me that the .p8 key is owned by root only. I ran...

sudo chown logstash:socore /etc/pki/elasticfleet-logstash.p8

...followed by...

salt-call state.apply ssl,nginx,logstash

To see if that might fix it. But unfortunately I'm still seeing the same error inside my Logstash container.

logstash@so-logstash:~$ tail /var/log/logstash/logstash.log -n 50 | grep "\]\["
[2025-07-09T16:48:44,665][INFO ][org.logstash.beats.BeatsHandler] [local: 172.17.1.29:5055, remote: 10.10.0.4:56826] Handling exception: io.netty.handler.codec.DecoderException: javax.net.ssl.SSLHandshakeException: Received fatal alert: bad_certificate (caused by: javax.net.ssl.SSLHandshakeException: Received fatal alert: bad_certificate)
[2025-07-09T16:48:44,666][WARN ][io.netty.channel.DefaultChannelPipeline] An exceptionCaught() event was fired, and it reached at the tail of the pipeline. It usually means the last handler in the pipeline did not handle the exception.

In your Logstash input you are using a crt and key file, it is not clear if you are using the pkcs8 file as required.

Your issue is related to something being wrong with the certificated, how did you created them?

I would suggest that you recreate them following this documentation.

Apologies I think I misunderstood.

I went back into the docker container, went into the /usr/share/logstash/ directory, and then ran...

openssl pkcs8 -inform PEM -in elasticfleet-logstash.key -topk8 -nocrypt -outform PEM -out elasticfleet-logstash.pkcs8.key

...which completed without errors.

Then exited the docker container and updated the Logstash input to point ssl_key at the pkcs8 key:

input {
  elastic_agent {
    port => 5055
    tags => [ "elastic-agent", "input-{{ GLOBALS.hostname }}" ]
    ssl => true
    ssl_certificate => "/usr/share/logstash/elasticfleet-logstash.crt"
    ssl_key => "/usr/share/logstash/elasticfleet-logstash.pkcs8.key"
    ssl_verify_mode => "none"
    ecs_compatibility => v8
  }
}
filter {
if ![metadata] {
  mutate {
    rename => {"@metadata" => "metadata"}
  }
}
}

Then I ran sudo salt-call state.apply ssl,nginx,logstash which seems to have made the errors go away. But now something seems to be preventing Elastic Agent from communicating to port 5055. I can no longer connect from my Windows host to port 5055 unless I put it back.

Can you telnet to the logstash server and port from the windows host?

What errors are you seeing on the the elastic agent side?

Did you look at the agent status? Logs?

You are going to need to dig in... you changed the default port... what else did you change?

@stephenb I didn't actually change the port. When I did a standalone network install with so-setup-network that's the port that Security Onion set up for me. I only changed ssl_verify_mode to "none", deleted the ssl_certificate_authorities line, and then changed ssl_key to the .pkcs8 key.

The agent still shows healthy on the UI, but no logs come through unless I go change back to the original elasticfleet-logstash.key key, in which case I get the Logstash SSL errors.

With the .pkcs8 key in-place, this is some of what I see when looking at the logs directly on the Windows host (apologies, the formatting here sucks):

{"log.level":"error","@timestamp":"2025-07-09T18:22:14.931Z","message":"Failed to connect to
failover(backoff(async(tcp://34.67.36.189:5055)),backoff(async(tcp://so-manager:5055)),backoff(async(tcp://10.10.0.13:5055))): dial tcp 34.67.36.189:5055: connectex: A connection attempt failed because the
connected party did not properly respond after a period of time, or established connection failed because connected host has failed to respond.","component":{"binary":"metricbeat","dataset":"elastic_agent.metri
cbeat","id":"beat/metrics-monitoring","type":"beat/metrics"},"log":{"source":"beat/metrics-monitoring"},"log.logger":"publisher_pipeline_output","log.origin":{"file.line":149,"file.name":"pipeline/client_worker
.go","function":"github.com/elastic/beats/v7/libbeat/publisher/pipeline.(*netClientWorker).run"},"service.name":"metricbeat","ecs.version":"1.6.0","ecs.version":"1.6.0"}
{"log.level":"info","@timestamp":"2025-07-09T18:22:29.375Z","message":"Non-zero metrics in the last 30s","component":{"binary":"metricbeat","dataset":"elastic_agent.metricbeat","id":"beat/metrics-monitoring","t
ype":"beat/metrics"},"log":{"source":"beat/metrics-monitoring"},"service.name":"metricbeat","monitoring":{"ecs.version":"1.6.0","metrics":{"beat":{"cpu":{"system":{"ticks":500,"time":{"ms":32}},"total":{"ticks"
:1078,"time":{"ms":64},"value":1078},"user":{"ticks":578,"time":{"ms":32}}},"info":{"ephemeral_id":"66b9ef4a-30ee-4aff-9457-485292cbff57","uptime":{"ms":871284},"version":"8.17.3"},"memstats":{"gc_next":7166125
6,"memory_alloc":32026976,"memory_total":83657760,"rss":116121600},"runtime":{"goroutines":60}},"filebeat":{"harvester":{"open_files":0,"running":0}},"libbeat":{"config":{"module":{"running":4}},"output":{"even
ts":{"active":0},"read":{"errors":1},"write":{"bytes":254,"latency":{"histogram":{"count":0,"max":0,"mean":0,"median":0,"min":0,"p75":0,"p95":0,"p99":0,"p999":0,"stddev":0}}}},"pipeline":{"clients":4,"events":{
"active":28,"published":4,"retry":4,"total":4},"queue":{"added":{"events":4},"filled":{"bytes":0,"events":28,"pct":0.00875},"max_bytes":0,"max_events":3200}}},"metricbeat":{"beat":{"stats":{"events":4,"success"
:4}}},"registrar":{"states":{"current":0}}}},"log.logger":"monitoring","log.origin":{"file.line":192,"file.name":"log/log.go","function":"github.com/elastic/beats/v7/libbeat/monitoring/report/log.(*reporter).lo
gSnapshot"},"ecs.version":"1.6.0"}
{"log.level":"error","@timestamp":"2025-07-09T18:22:39.423Z","message":"Failed to connect to
failover(backoff(async(tcp://34.67.36.189:5055)),backoff(async(tcp://so-manager:5055)),backoff(async(tcp://10.10.0.13:5055))): read tcp 10.10.0.4:58325->10.10.0.13:5055: wsarecv: An existing connection was
forcibly closed by the remote host.","component":{"binary":"metricbeat","dataset":"elastic_agent.metricbeat","id":"beat/metrics-monitoring","type":"beat/metrics"},"log":{"source":"beat/metrics-monitoring"},"ser
vice.name":"metricbeat","ecs.version":"1.6.0","log.logger":"publisher_pipeline_output","log.origin":{"file.line":149,"file.name":"pipeline/client_worker.go","function":"github.com/elastic/beats/v7/libbeat/publi
sher/pipeline.(*netClientWorker).run"},"ecs.version":"1.6.0"}
{"log.level":"error","@timestamp":"2025-07-09T18:22:43.804Z","message":"Failed to connect to
failover(backoff(async(tcp://34.67.36.189:5055)),backoff(async(tcp://so-manager:5055)),backoff(async(tcp://10.10.0.13:5055))): dial tcp 34.67.36.189:5055: connectex: A connection attempt failed because the
connected party did not properly respond after a period of time, or established connection failed because connected host has failed to respond.","component":{"binary":"metricbeat","dataset":"elastic_agent.metri
cbeat","id":"http/metrics-monitoring","type":"http/metrics"},"log":{"source":"http/metrics-monitoring"},"log.logger":"publisher_pipeline_output","log.origin":{"file.line":149,"file.name":"pipeline/client_worker
.go","function":"github.com/elastic/beats/v7/libbeat/publisher/pipeline.(*netClientWorker).run"},"service.name":"metricbeat","ecs.version":"1.6.0","ecs.version":"1.6.0"}

So I am not a Security Onion user / expert. The default agent to logstash port is 5044 but looks like both sides are in sync

So, as I suggested, can you telnet to the host port from the windows box

And did you fix the certs on the agent side?

@stephenb I don't have Telnet on the box. I can ping the IP but I can't connect to that port.

PS C:\Users\Administrator\Downloads> Test-NetConnection 10.10.0.13 -Port 5055
WARNING: TCP connect to (10.10.0.13 : 5055) failed


ComputerName           : 10.10.0.13
RemoteAddress          : 10.10.0.13
RemotePort             : 5055
InterfaceAlias         : Ethernet
SourceAddress          : 10.10.0.4
PingSucceeded          : True
PingReplyDetails (RTT) : 0 ms
TcpTestSucceeded       : False

However if I switch my Logstash Input config back to what it shows in my second post here, then Test-NetConnection 10.10.0.13 -Port 5055 actually succeeds, but I see the Logstash SSL errors inside the Logstash container.

I don't quite understand how to fix the certs on the agent side.

When I follow the instructions here (as @leandrojmp recommended) it works for me.

Did you put the new certs you generated back into the Agent Config
This is a self managed Agent I guess...
Good Question is the Standalone Agent or Fleet Managed?

I don't have the elasticsearch-certutil command and I'm still trying to figure out how to get it so that I can follow along. The instructions at the top of that page are trying to get me to stand up an entirely new instance of Elasticsearch/Kibana on top of my existing server which I imagine is probably going to cause more problems.

I don't think this is a self-managed Agent. I have it connected via Fleet UI.

Just download elasticsearch tar or zip unzip it and it will be in the bin directory

You don't need it on each host... just somewhere you can use it