A very strange question, I don't start any filebeat service, but just configure beats as input in my logstash.conf, and elasticsearch as my output. But in kibana I still can see data index created and data fetched in real time. Whats the reason?

It could be coming from another logstash instance, it could be coming from another beat. I would add
add_field => { "sourceLogstash" => "Hello, it's me!" }
then start looking at the data in the elasticsearch index. Beats typically add metadata saying which beat they are (including which host they are running on), if your logstash instance is sending the events then that [sourceLogstash] field should show up. This should tell you whether there is another logstash instance involved, or another beat sending data to your instance.
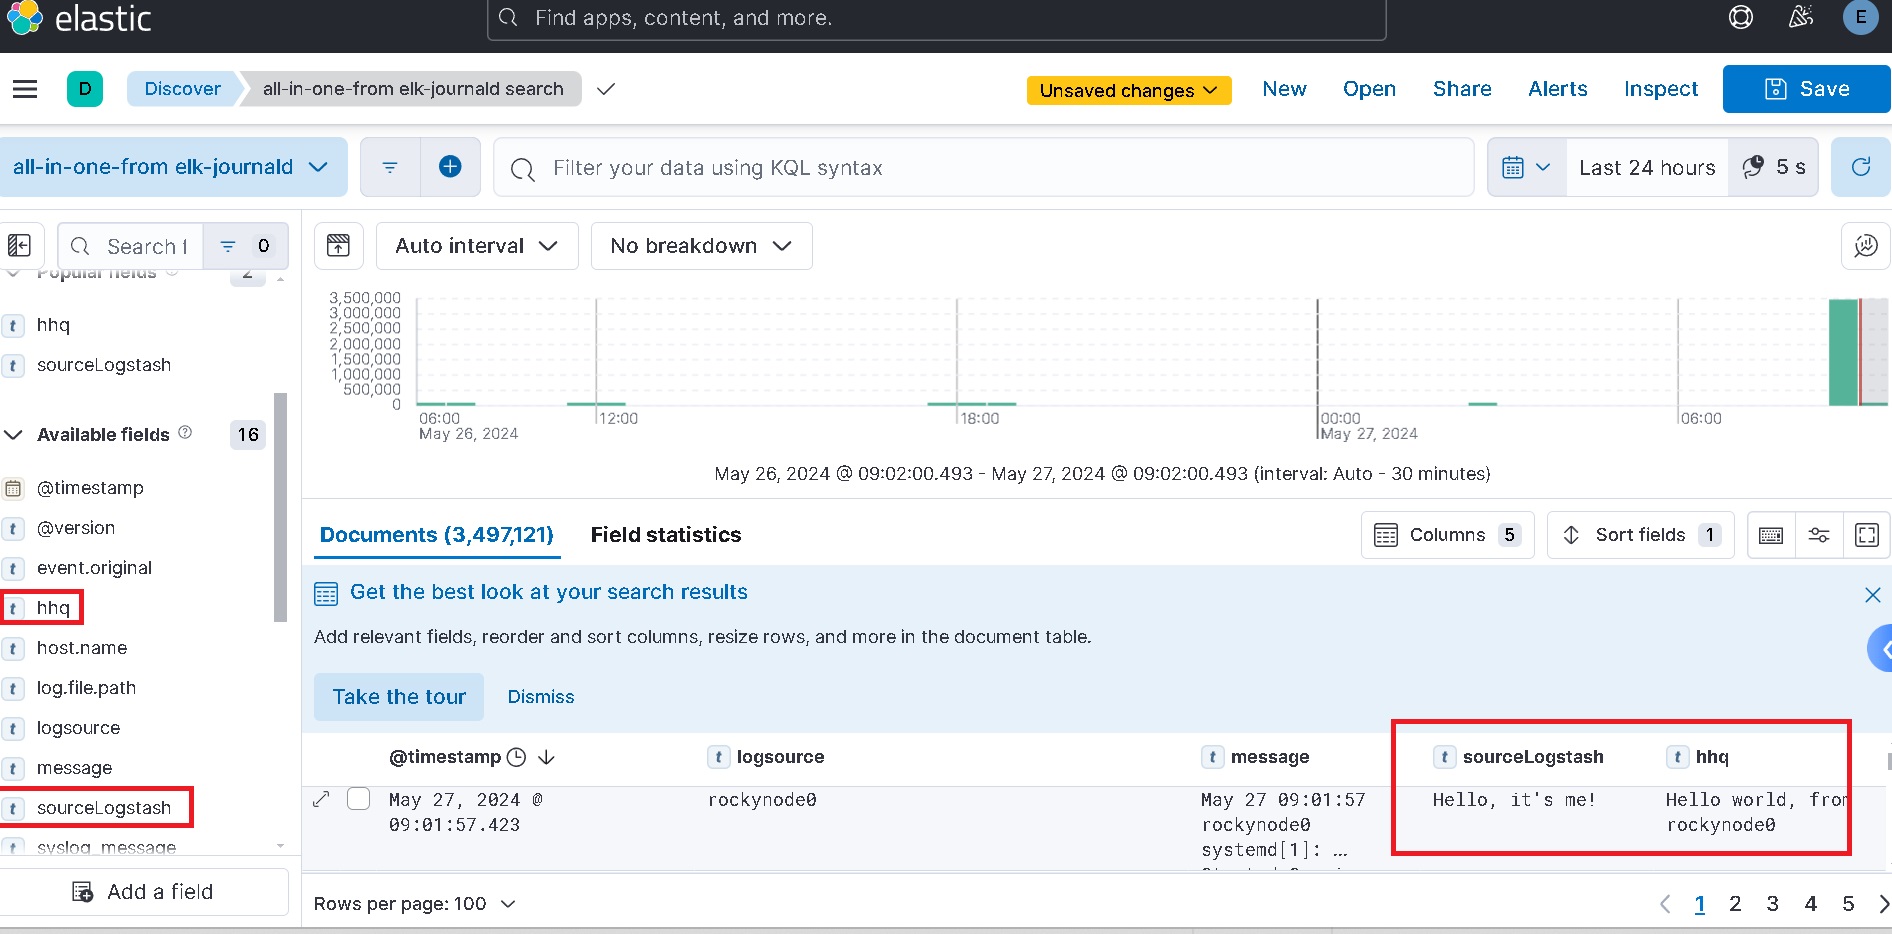
Really strange, I have two logstash filter conf files located in /etc/logstash/conf.d. "logstash-filebeat.conf" is used for choose filebeat as input, and I have shown you above. I have stopped filebeat servies. "logstash-syslog.conf" is another one and I choose syslog as input. I added "sourceLogstash" as the new filed, but I can see the data view fetched by "logstash-filebeat.conf" have both new added fields[hhq, sourceLogstash]. These two fields are defind in "logstash-filebeat.conf" and "logstash-syslog.conf". Why in "logstash-filebeat.conf" linked data view can see both?


That sounds like you want to have two independent configurations. If you point path.config to a directory then it will read both configs in a single pipeline, read events from both inputs and send those events to both outputs. You can adjust that using conditionals, but you need those on the filters as well as the outputs.
Misunderstanding this is a very, very common mistake for beginners. (See here and here for examples.)
You can use pipelines.yml to run each configuration is a separate pipeline, which is probably what you want.
Now clear. Thanks for your support.