Logstash reporting error sending to Elasticsearch

I have just finished rebuilding my entire ELK stack environment. I got the clusters build last night and finished turning everything back on about 3 hours ago.

With the help of others in here and the Logstash forums, I was able to correct several settings related to shards and replicas. So, here is a quick run down of my setup. I have 26 locations, running Logstash, that parse and forward into 2 data center clusters.

Each DC cluster is 8 servers.

  • 1 Kibana client node
  • 3 Master nodes
  • 4 Data nodes

All external Logstash servers are configured for all 3 master nodes, round robin.

output {
  elasticsearch {
    hosts => ["http://x.x.x.x:9200","http://x.x.x.x:9200","http://x.x.x.x:9200"]
    index => "logstash-%{+YYYY.MM.dd}"
  }
}

I get this from checking the cluster health:

MASTER-SERVER:~$ curl -XGET 'http://localhost:9200/_cluster/health?pretty=true'
{
  "cluster_name" : "CLUSTER",
  "status" : "green",
  "timed_out" : false,
  "number_of_nodes" : 8,
  "number_of_data_nodes" : 4,
  "active_primary_shards" : 9,
  "active_shards" : 9,
  "relocating_shards" : 0,
  "initializing_shards" : 0,
  "unassigned_shards" : 0,
  "delayed_unassigned_shards" : 0,
  "number_of_pending_tasks" : 0,
  "number_of_in_flight_fetch" : 0,
  "task_max_waiting_in_queue_millis" : 0,
  "active_shards_percent_as_number" : 100.0
}

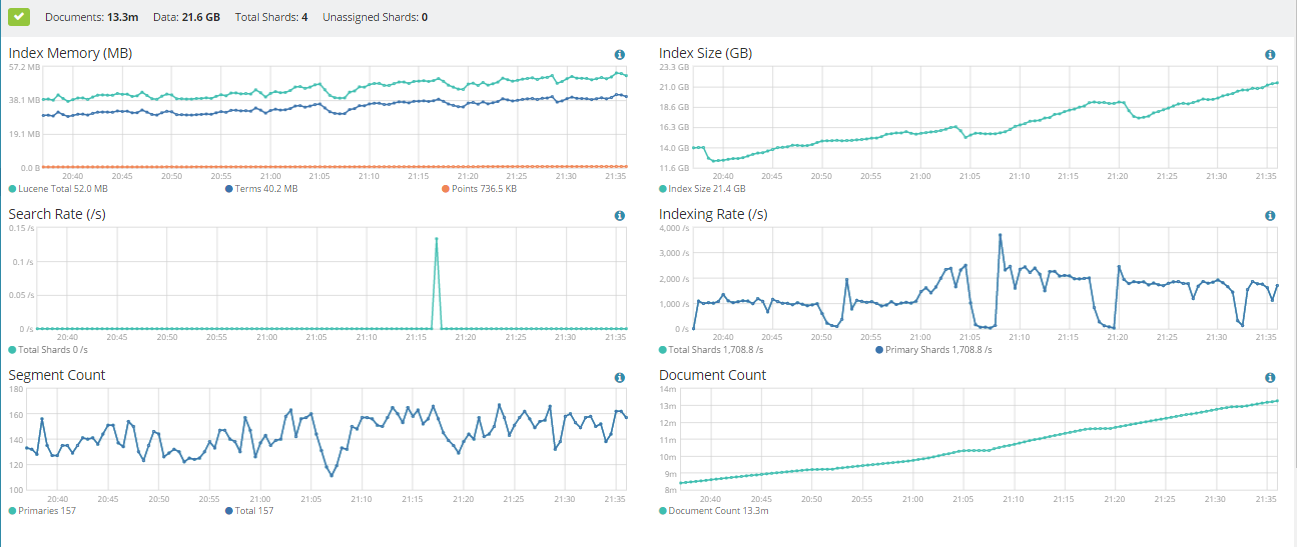
Here is a shard count:

MASTER-SERVER:~$ curl -XGET 'http://localhost:9200/_cat/count?v'
epoch      timestamp count
1484950824 17:20:24  30078971

Here are the settings:

MASTER-SERVER:~$ curl -XGET 'http://localhost:9200/_settings?pretty'
{
  "logstash-2017.01.19" : {
    "settings" : {
      "index" : {
        "refresh_interval" : "5s",
        "number_of_shards" : "4",
        "provided_name" : "logstash-2017.01.19",
        "creation_date" : "1484943134900",
        "number_of_replicas" : "0",
        "uuid" : "957Z9QcUSJSCzc97AJhK7A",
        "version" : {
          "created" : "5010299"
        }
      }
    }
  },
  "logstash-2017.01.20" : {
    "settings" : {
      "index" : {
        "refresh_interval" : "5s",
        "number_of_shards" : "4",
        "provided_name" : "logstash-2017.01.20",
        "creation_date" : "1484940151889",
        "number_of_replicas" : "0",
        "uuid" : "PL2WTAWETAulatYdccILaw",
        "version" : {
          "created" : "5010299"
        }
      }
    }
  }
}

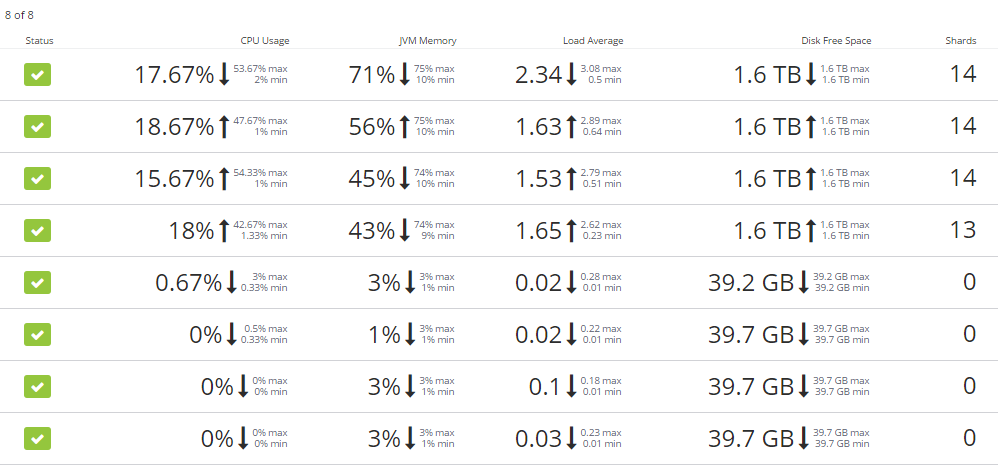
Here the status of my shards:

manager@KNOX-LOGMS-01:~$ curl -XGET 'http://localhost:9200/_cat/shards?v&s=node'
index               shard prirep state      docs   store ip          node
logstash-2017.01.20 0     p      STARTED 9030811  17.6gb x.x.x.x DATA-NODE01
logstash-2017.01.19 0     p      STARTED   86795  54.5mb x.x.x.x DATA-NODE01
logstash-2017.01.20 1     p      STARTED 9016759  17.8gb x.x.x.x DATA-NODE02
logstash-2017.01.19 1     p      STARTED   85824  53.8mb x.x.x.x DATA-NODE02
logstash-2017.01.20 3     p      STARTED 9042439  17.7gb x.x.x.x DATA-NODE03
logstash-2017.01.19 3     p      STARTED   85905  53.8mb x.x.x.x DATA-NODE03
logstash-2017.01.20 2     p      STARTED 8998451  17.7gb x.x.x.x DATA-NODE04
logstash-2017.01.19 2     p      STARTED   85581  53.7mb x.x.x.x DATA-NODE04

Here is a log that I am seeing, coming from one of the endpoint, running Logstash forwarding to the DC cluster.

<13>Jan 20 16:44:13.869466 LOGSERVER [2017-01-20T16:44:12,960][INFO ][logstash.outputs.elasticsearch] retrying failed action with response code: 429 ({"type"=>"es_rejected_execution_exception", "reason"=>"rejected execution of org.elasticsearch.transport.TransportService$6@b0521cb on EsThreadPoolExecutor[bulk, queue capacity = 50, org.elasticsearch.common.util.concurrent.EsThreadPoolExecutor@300b72e4[Running, pool size = 4, active threads = 4, queued tasks = 50, completed tasks = 2142248]]"})

I am at a loss as to what is left to do.

Anyone?

Dedicated master nodes should not serve traffic, but rather be left to just managing the cluster. This makes it possible to deploy them on much less powerful hosts that other node types. You should therefore configure you Logstash instances to send indexing requests directly to all 4 data nodes instead.

Ahhhhh okay. I made the assumption that they receive the traffic and then directed it to the correct data node.

Christian,thank you!!!!!!

I've spent weeks trying to figure this out. I either completely missed it or it's not documented to not send to master nodes.

We do mention it's best not to do this here - Node | Elasticsearch Guide [5.1] | Elastic

Should we call it out with a bit more importance?

Uhhh!!! Yea, I even get what you said and what you meant and that page still doesn't even make that clear to NOT send incoming data to a Master node. :slight_smile:

I would say, that needs to be in HUGE letters. I've literally been trying to fix this problem for weeks!!!!!

Mark,
I have an update.

As it stands, I have 31 shippers, running Logstash, that ship to each of my Data Center clusters (there are two).

Of all these Logstash servers, only ONE is still having the "es_rejected_execution_exception" error.

I turned OFF the output for the ES cluster in Data Center A and just left Data Center B going. The errors stopped.

I turned on the output for Data Center A and the errors came back.

I then turned OFF the output for Data Center B and left Data Center A going. The errors AGAIN stopped.

This is the ONLY server having this problem.

ALL 31 servers were rebuilt, at the same time, over the weekend. All, running 5.1.2.

Any ideas what to do now?

So now, it appears that all of the Logstash forwards are generating this message.

This is getting incredibly irritating.

Do you have Monitoring installed to see why it may be happening

I actually do not :frowning:

I was just checking the status of each data center cluster and do not see anything wrong, from what I can curl.

I got the license for Monitoring yesterday and just have not set it up yet.

Been finalizing my rebuild.

Any suggestions on what else I can check?

Mark I have installed the X-Pack on both clusters.

I guess my issue is, the error messages are being recorded from the Logstash outputs, from the remote shippers.

Yes but 429's are ES saying it's overloaded. So you need to match one of these errors to something in ES.

Ok, so let me see if I understand this error correctly.

Logstash is using a ES output (which I am guessing is how it is getting the rejection message back to Logstash).

That error message then gets logged into my Logstash log files.

I have syslog-ng monitoring each Logstash instance so I can collect those messages

So my concern is NOT with Logstash but IS with ES.

Each Logstash instance has 4 data node targets.

I am attaching some screenshots from the Monitoring plugin.

I really need some guidance here.

I am just not following what the root cause of these errors are:

<13>Jan 25 13:52:16.867289 LOGSTASH [2017-01-25T13:52:16,681][INFO ][logstash.outputs.elasticsearch] retrying failed action with response code: 429 ({"type"=>"es_rejected_execution_exception", "reason"=>"rejected execution of org.elasticsearch.transport.TransportService$6@4c5a18de on EsThreadPoolExecutor[bulk, queue capacity = 50, org.elasticsearch.common.util.concurrent.EsThreadPoolExecutor@eb9adb8[Running, pool size = 4, active threads = 4, queued tasks = 50, completed tasks = 6362360]]"})

I have each Logstash shipper, configured with all 4 data nodes.

elasticsearch {
  hosts => ["http://x.x.x.x:9200","http://x.x.x.x:9200","http://x.x.x.x:9200","http://x.x.x.x:9200"]
  index => "logstash-%{+YYYY.MM.dd}"
  user => "xxxxxxxx"
  password => "xxxxxxxx"
}

I have X-Pack installed now but either don't know where to look or do not see any errors. Any my curl health checks show all green, shards in good shape, indexes in good shape.

The nodes CPU and memory appear to NOT be being over utilized.

Disk space is plenty and I don't see any queuing.

Please help.

Anyone?

You've got some high heap use there, do the times of the 429's align with GC?

Mark they're pretty much constant to both data center clusters. I'm running on average 7-10 million logs an hour.

Mark,
I added 16 more gig of ram to each data node.

Now, one of the data nodes will NOT join the cluster.

All I did was stop ES. Shutdown all the servers. Add RAM. Power back on.

I am STILL getting 429s.

This makes absolutely zero sense.