Hi everyone,
I'm currently integrating MISP with the Elastic Stack (ELK 8.17.3) and need some help figuring out why data isn't showing up in Kibana.
Setup overview:
- MISP server running Filebeat.
- Filebeat sends data directly to Elasticsearch on port 9210 (not using Logstash).
- Kibana running on port 5601.
- Elasticsearch responds correctly with:
{
"name": "node-0",
"cluster_name": "dfir-cluster",
"version": {
"number": "8.17.3"
}
}
- Filebeat test config →
 OK
OK - Filebeat test output →
 connection OK (certificate warning only)
 - MISP REST API works fine — I can retrieve events and attributes using curl.
Filebeat output section (simplified):
output.elasticsearch:
hosts: ["https://<ELK-IP>:9210"]
username: "intern"
password: "<redacted>"
pipeline: "misp_pipeline"
ssl.verification_mode: none
{
"processors": [
{ "json": { "field": "message", "target_field": "misp_event" } }
],
"on_failure": [
{ "set": { "field": "ioc_value", "value": "{{misp_event.Attribute.0.value}}" } },
{ "set": { "field": "ioc_type", "value": "{{misp_event.Attribute.0.type}}" } },
{ "set": { "field": "event_info", "value": "{{misp_event.Event.info}}" } }
]
}
Problem:
-
Filebeat and Elasticsearch connection work fine.
-
Index appears in
_cat/indices, but contains 0 documents. -
Kibana shows “0 available fields. X empty fields.”
I’m not sure if the issue is with:
-
the ingest pipeline,
-
field mapping,
-
or something in how the MISP module handles input JSON.
Screenshots included:
-
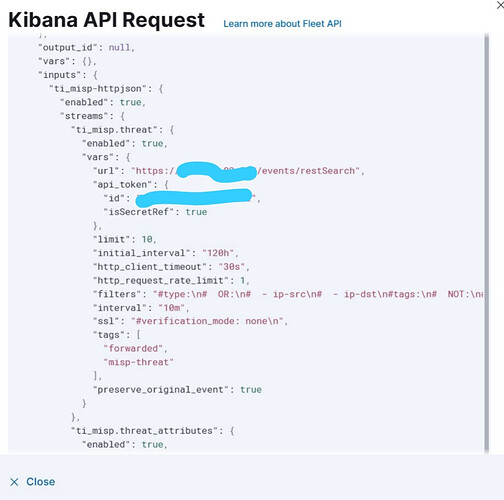
API Preview page (
/app/integrations/edit-integration/<UUID>). -
Kibana index pattern showing empty fields.
Any guidance or working example of a valid MISP → Filebeat → Elasticsearch setup (with or without Logstash) would be very helpful.
Thanks in advance!
