Missing bar in vertical bar visualisation

Hi folks. I am trying to create a visualisation based on MetricBeat data, showing memory utilisation by server.
The weird thing is that for one of my servers (ca-web06), the bar is blank:

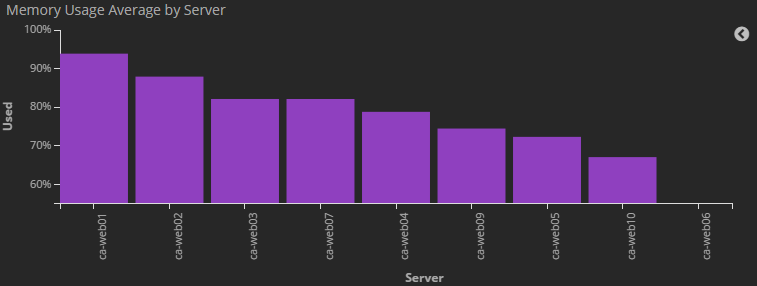
Even though the data for this server clearly returns a value:

The actual response from ES looks a bit like this:

 {
  "took": 2,
  "timed_out": false,
  "_shards": {
    "total": 1,
    "successful": 1,
    "failed": 0
  },
  "hits": {
    "total": 132,
    "max_score": 0,
    "hits": []
  },
  "aggregations": {
    "2": {
      "doc_count_error_upper_bound": 0,
      "sum_other_doc_count": 0,
      "buckets": [
        {
          "1": {
            "value": 0.9095000000000001
          },
          "key": "ca-web01",
          "doc_count": 12
        },
        {
          "1": {
            "value": 0.7822666666666666
          },
          "key": "ca-web02",
          "doc_count": 15
        },
        {
          "1": {
            "value": 0.7965333333333333
          },
          "key": "ca-web03",
          "doc_count": 15
        },
        {
          "1": {
            "value": 0.7449999999999999
          },
          "key": "ca-web04",
          "doc_count": 15
        },
        {
          "1": {
            "value": 0.7727333333333333
          },
          "key": "ca-web05",
          "doc_count": 15
        },
        {
          "1": {
            "value": 0.5485333333333334
          },
          "key": "ca-web06",
          "doc_count": 15
        },
        {
          "1": {
            "value": 0.7930666666666666
          },
          "key": "ca-web07",
          "doc_count": 15
        },
        {
          "1": {
            "value": 0.7433333333333333
          },
          "key": "ca-web09",
          "doc_count": 15
        },
        {
          "1": {
            "value": 0.6876666666666668
          },
          "key": "ca-web10",
          "doc_count": 15
        }
      ]
    }
  },
  "status": 200
}

Hi @Cylindric,

could you please let us know which version of Kibana you are using?

Sorry, yes: 5.2.0, it's an ES Cloud instance.

From the way the y-axis looks I would guess that "Scale Y-Axis to Data Bounds" is checked in the visualization options. This means that the last bar has a minimal height, because it defines the lower bound of the y-axis scale.

Ah yes, that does look like the culprit, although I do not have that ticked. I have it set to scale from 0 to 1.

It's almost as if the "Set Y-Axis Extents" option is actually wired into the "Scale to Data-Bounds" option.

I can reproduce that and it feels like a bug to me. Setting something like 0.0000000001 as the lower bound seems to work as excpected for me.

Oh, interesting. I should probably see if there's a bug report for that already.

Thank you for filing the bug report, @Cylindric!

It can be found at https://github.com/elastic/kibana/issues/10468 for everyone who finds this thread later.

This topic was automatically closed 28 days after the last reply. New replies are no longer allowed.