Hi Team,
I've been experiencing an issue with error stacktrace visibility for a while now.
I am using the latest as for now v8.11.1 deployment version in Elastic Cloud.
I do have a JS elastic rum being initialized in webpage source code, providing all required information including serviceName, serverUrl, serviceVersion, environment, etc.
To reduce transaction volume overhead and its cardinality, I even introduced pageLoadTransactionName for those pages that differ by a "product ID", its name, etc.
I do upload source maps as well and can successfully find them while querying Elasticsearch.
Furthermore, I bumped the Integration server setup to be more powerful in resolving collected data, but still without success.
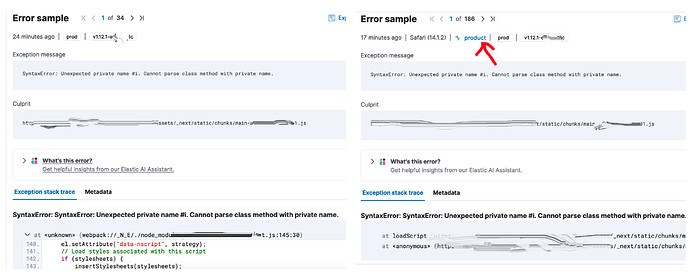
The problem I have is that error stacktraces are shown only when no transaction is matched with the error. The same error has an insight into stacktrace, but only if no transaction is glued to it. Same error, same version, same environment, same source map, same js file, same exception message, same culprit file, the only difference is that one has existing span, trace and transaction data, the other does not. Please see the attached screenshot for comparison.
Thank you in advance.
Kind regards,
Blaise
