A couple of the ML jobs we are running in our environment have hit their "hard limit". I have expanded the "model_memory_limit" to allow them more resources in order to run, but they continued to hit the hard limit. When I am looking at the "counts" tab for the specific job in the ML interface I see the following "model_bytes_memory_limit" still set to a number that is too low for the model to be able to work. I haven't been able to find a way to manipulate that field, or even research the field very much to see if that is something I should be touching.
In your other post, I explained how to roughly estimate the required memory (using the ~30kB per entity value). You'll need to figure out the rough cardinality of the data set you expect to analyze and adjust accordingly. Otherwise, you can just keep trying increased values until the job stops throwing HARD_LIMIT errors.
Thanks for the response. I finally understand how cardinality affects resource utilization when it comes to a single partition job. In the job that we were discussing in the previous post that is split twice, how does that second split affect resources. To make things easy say the cardinality of each split is 1000. Does the rough math look like 30kb * 1000 + 30kb * 1000 to take into account each of the splits? Or is it different. Thanks.
Not quite that easy. First of all, the memory requirements for a partition field are a little more than for a by field. Partitions are like 25kB-30kB and by fields are like 10kB-15kB. Secondly, in a double split scenario, you have to work out the combinatorics. So, for example, let's say you are analyzing a field called host.name and one called process.name. Let's say you have 50 unique hosts and 100 unique process names (total).
If you did count by process partition=host, then certainly you'll get 50 partitions for sure, but you may not know if all 100 processes exist on every host. If that IS the case then you'll have 5000 (50*100) unique combinations of things that ML has to track (host1:process1, host1:process2,....host50:process100) <---there will be 5000 items in this liist
On the other hand, let's assume the extreme opposite in that 49 hosts have only 1 process running on it and 1 host has 100 processes. There is now only a total of 149 unique combinations (49+100).
Your memory requirement should be therefore on the order of 20kB times the number of unique combinations.
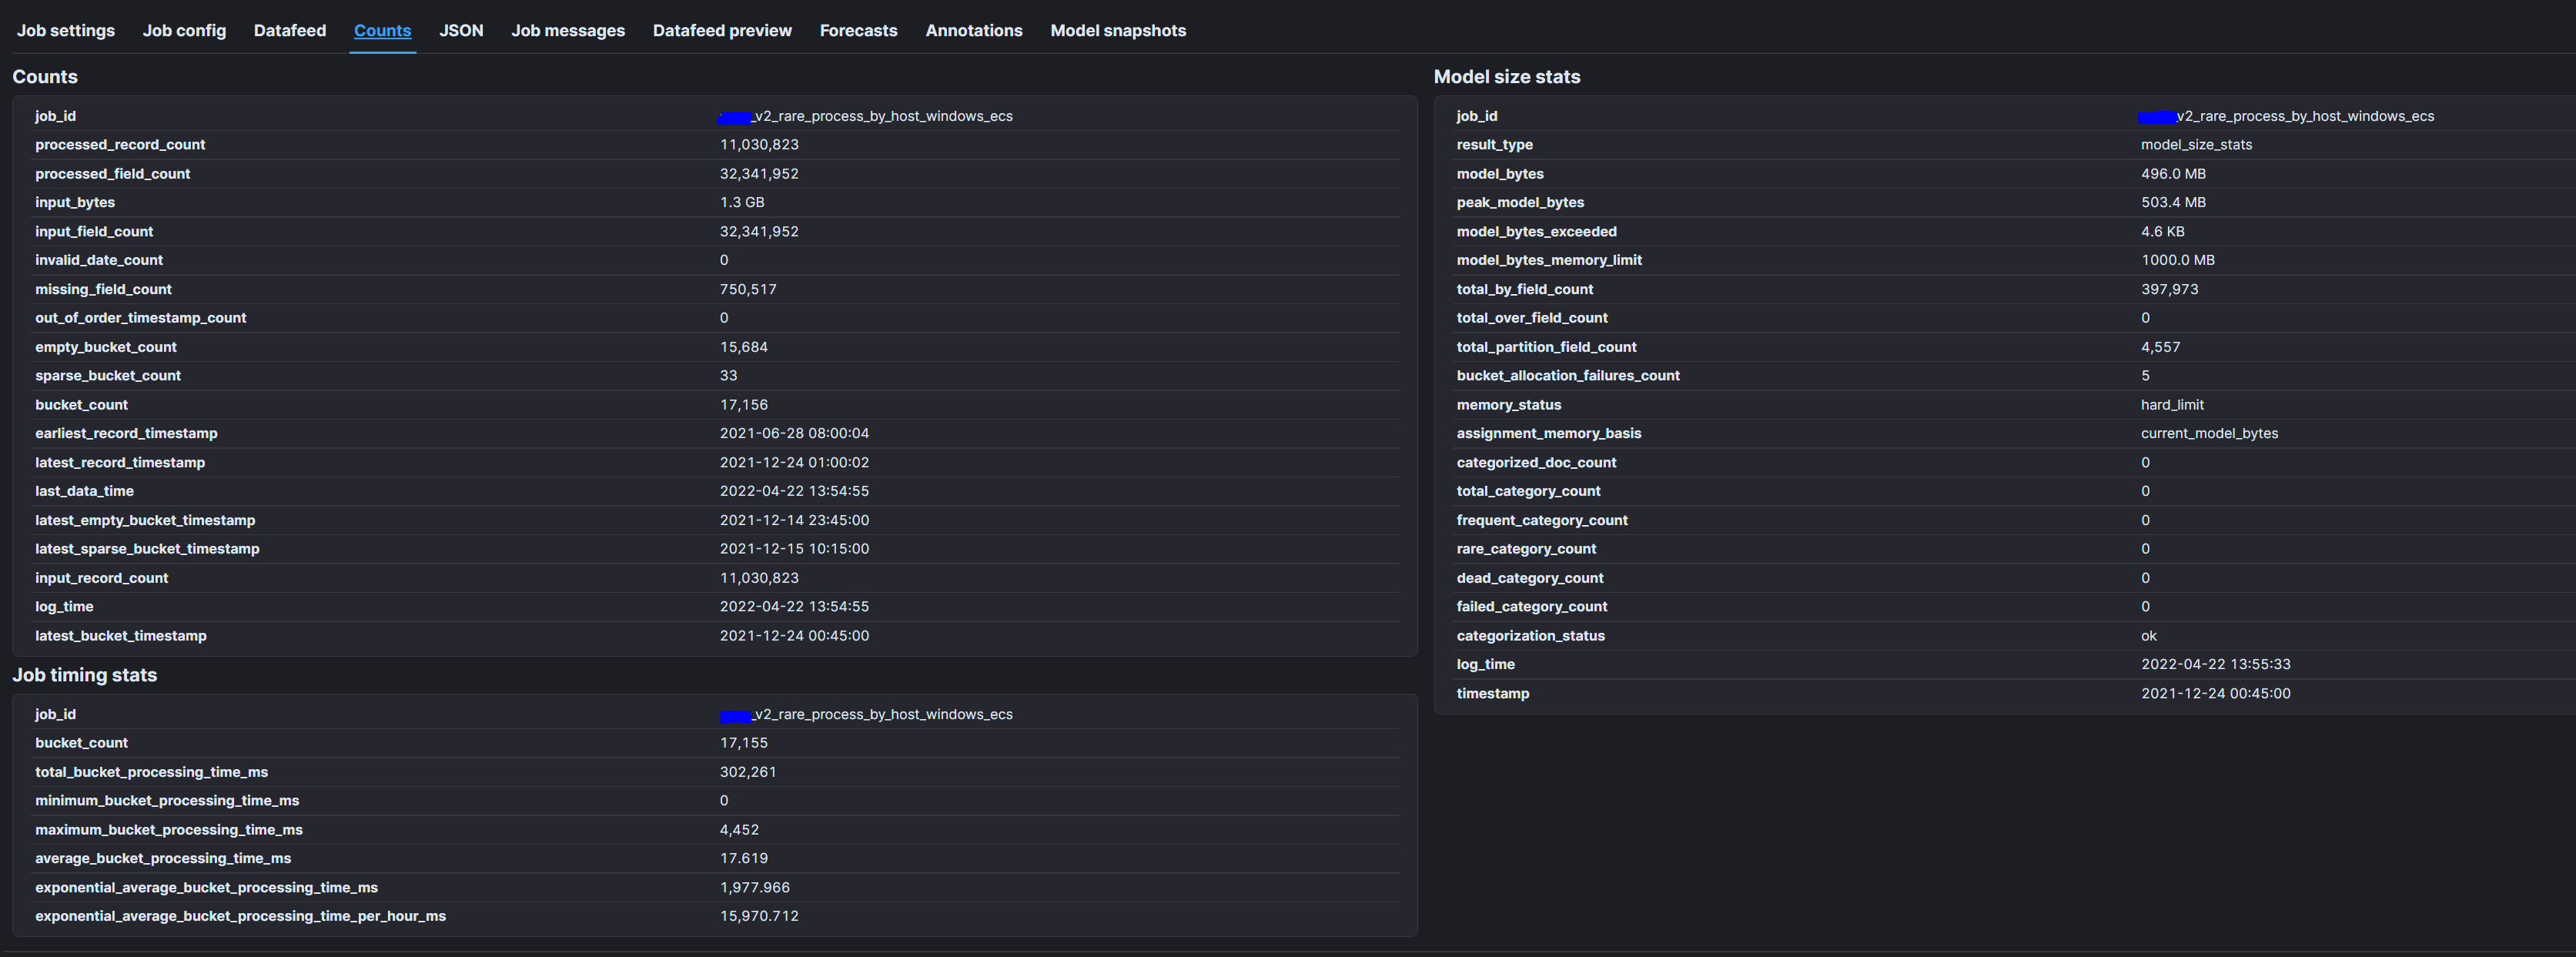
Thanks for getting back to me so quickly, and I appreciate that explanation things are becoming a little less hazy. The following screen shots are from a job that has been grinding my gears. I am going to try to explain what is going on here and if you don't mind illuminating where I am going off the path I would appreciated it. This job follows similar logic to the hypothetical job you described above.
As you can see from the first screen shot this is rare by "process.name" partition_field_name="host.name" so the fields of interest are process.name and host.name. Based on the second screen shot we have 397,973 processes each of which is responsible for 10-15kb as the process.name is the by_field.
Then, we have 4,557 host.names which is the partition_field each of which is holding 25-30kb.
So, the information that we don't have easy access to is how many of those processes are happening on each of the hosts. I am going to try to replicate the logic that you were trying to get across above that describes what is happening: (process1:host1(if the process is present on this host), process1:host2, xxxx, process397,973:host4,557).
The above is really ugly, but it seems like the by_field just at a conservative 10kb per entity would require 4gb of memory. Determining exactly how many of these processes are on each host hurts my brain. I feel like I am missing something here as well, because the logic underlying this job seems to cause a pretty inefficient mathmatical situation. If my understanding isn't flawed.
As an intermediate question: Does the "model" (I don't know if that is the right term to use here) run through every possible permutation based on the way this job is laid out. It seems like the by_field being processed would require it to at least check to see if one of the 5000 hosts is running that process, before moving to the next process where it would have to go through and see if the process is running on that host and if it is then actually make a model for that entity.
I am just going to leave it at that for now, as this is becoming quite verbose....
In other words, host.name:eden-sec-log4sh has 295 processes and host.name:app-server1 has 144 processes.
(This is just the Transform _preview endpoint, but you can run a transform as a background process over all of your relevant data and the output can go to a new index to be looked at later.
Since the job sees data in chronological order, you can assume that when the ML job starts, it has no knowledge of how many hosts and how many processes (and thus how many processes per host) to expect (Note: for now ignore the validation step of the ML job being created in the ML UI which actually tries to make some guesses via quick background queries/aggregations).
So, when the ML job starts seeing data, it says - "oh, here's a record for a process named processX on hostname hostY - do I have a hostY partition yet? If so, add processX to the list of processes for hostY. If not, then add the hostY partition and add processX to the list of processes for hostY". Let's say that in the first 15 minutes of inspecting data, the ML job has seen 37 hosts and 946 process/hosts combinations - it still is a long way from the end state, where there are actually like 5000+ hosts and 400,000+ process/host combinations. But, as time goes on, the model will grow as it encounters more of those combinations.
Therefore, setting a model_bytes_memory limit sort of requires you to think about the end state / worst-case scenario
Thank you for sharing that syntax that is exactly the information that I was looking for. The only question I have is, should we flip where we query host.name and process.name to get the right information if we are using the screen shots above as an example?
Sorry I wasn't able to try this for myself yet. I have to add the transform characteristic to at least one of our nodes. I need to look up more about that to determine if I should add it to more nodes as I think we are going to want to be able to do a fair amount of transforms as we get better at ML.
Anyways will that syntax basically give us the answer to, how many hosts have run x process.name?
Thanks for this response as well. I am going to rehash this one quickly to ensure that I have the idea.
So this job that we are using as an example starts running at a point in time as configured. At that point it hits process y running on host x at which point a partition is created for process y. The ML job sees that it is running on host x and that information is "added" (??) to the model. Once the model is finished with that event it moves onto the next one which is the same process on a different host which is also added to the model.
New models are created each time a new process is encountered. Now I am tripping up a little bit on this idea of "two splits". Does this mean that every time a process is encountered running on a new host the information about that host is added to the partition of the process? Or, is there actually a new "partition" created on the process.name partition for each specific host.name where the process is running?
Taking into account the "worst case scenario" seems to make it easier to determine how much memory you should set for each job. You could just act like every single process.name is running on every host.name which would be much easier math than trying to ID which processes are running on all 5000 hosts and then doing the math on that.
I am also wondering if I have misconstrued some of these basic terms.
rare by "process.name" partition_field_name="host.name"
I have been under the impression that this means that the analysis will be "split on" process.name, and that means there will be a model created for each occurrence of process.name. Now what is throwing me off is "partition_field_name". Does that mean for each model for each process.name there will be another model of host.name? Or, each model for process.name is focused on (for lack of a better term) each host.name it occurs on.
In my mind I am visualizing this job I am imagining one graph per process.name ( a representation of each model). Each of those graphs have host.name on their y-axis and something like @timestamp as the x-axis.
rare by "process.name" is misleading syntax rare("process.name") would give a better intuition. (The reasons for this being configured like this are lost to the sands of time.) In fact, for memory purposes rare by "process.name" is much lighter weight than say count by process name. It summarises bucket counts containing each distinct process.name rather than trying to model them each as a time series. Where as a time series model might be 10-20KB this might be 10-20B (once you take into account other bookkeeping state). However, we generally advise against doing rare by "process.name" on some astronomically high cardinality field: rare is generally meaningless for such data.
Turning to the other cases, count by x partition_field=y does indeed create one model for each (x, y) pair. However, "by" and "partition" do change how we aggregate anomaly scores: you can think of x describing attributes of y. We care particularly when several attributes are unusual at the same time.
For rare by x partition_field=y and count over x partition_field=y it does actually affect the modelling. For both these cases we create one model per y. For rare we summarise the counts of each value of x separately for each value of y. A particular value of x say x1 is rare in the context of a particular value of y say y1 depending on its counts relative to other counts of values of x for y1. A similar thing applies for population modelling: we compare x1 to a joint time series model for counts of different values x for a particular value of y.
From a memory standpoint over is somewhat heavier weight per distinct member of the population than rare. A rule of thumb would be 1-2KB per distinct member of the population.
Thanks for getting back to me. If I could get a little clarification on the following:
Is the field "process.name" the by_field in this example? I am going to comment on model sizes being lighter at the end of this response as I have been tracking the model sizes of my jobs and it mostly makes sense now as most of the jobs seem to be carrying roughly 1kb/entity cost.
I could use a little more detail, if possible, on:
Is the difference between summarizing a bucket count and modeling each into a time series the ability to identify anomalous buckets and then partitioning those anomalous buckets on "host.name"?
What is bookkeeping state? I have never seen that term before.
What does astronomically high mean? I included a screenshot at the bottom here with specifics of the jobs I have running right now, and I get the feeling that some of our jobs are solidly in the "astronomically high" category which is very helpful. I didn't realize that was the case.
Regarding:
In the case of the job mentioned above does this mean that every "host.name" gets its own model and each model is looking for anomalous occurrences of "process.name"?
Finally, I am going to include a screenshot of a document I drew up quickly. I think the jobs that we have running that are split once or using only one detector are functioning pretty predictably, but the jobs that we have running that are split twice seem to behaving strangely to my untrained eyes. Curious what your thoughts are, but I also understand I might be pushing it asking these questions in this forum. Either way thanks so much for everything to this point.
Apache, Apache Lucene, Apache Hadoop, Hadoop, HDFS and the yellow elephant
logo are trademarks of the
Apache Software Foundation
in the United States and/or other countries.