I've installed metricbeat in the Mongo server and I'm able to see the logs shipped to logstash and elastic into the kibana discovery, however when I open the dasboard I get the error " Could not locate that index-pattern (id: metricbeat-*), [click here to re-create it]"
Do you know what is going on?
To visualize and explore data in Kibana, you must create an index patterns. An index pattern tells Kibana which Elasticsearch indices contain the data that you want to work with. An index pattern can match a single index, multiple indices, and a rollup index.
Have you tried clicking click here to re-create it? Did that resolve your issue?
Hi @Nathan_Reese,
I have the index templates created already as you can see in the following image.
When I click to recreate the index it says that it is already created as you can see following:
Maybe the problem could be related to the logstash configuration, maily the input part as I'm only reading the beats. Could it be the problem?
input
 {
     beats {
    port => 5044
 }
}
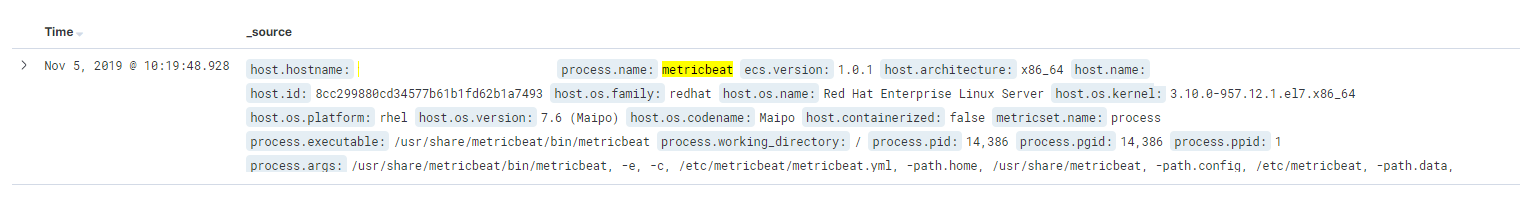
I'm also attaching a print where you can see the logs from metricbeat being shipped to elasticsearch / Logstash: