Dear experts,
after migration from 6.5.4 to 7.10.2, I cannot display anymore my logs collected by the default Filebeat MongoDB module in Kibana Dashboard Overview [Filebeat MongoDB].
I notice some updates in the provided pipeline filebeat-x.x.x-mongodb-log-pipeline between 6.5 and 7.10.
For instance, the field mongodb.log.severity in 6.5 is replaced by log.level in 7.10 but according to 7.10 documentation mongodb.log.severity is defined as an alias to log.level. However mongodb.log.sevirity is not displayed anymore in Kibana Discover view left pannel i.e. only mongodb.log.component and mongodb.log.context are still available.
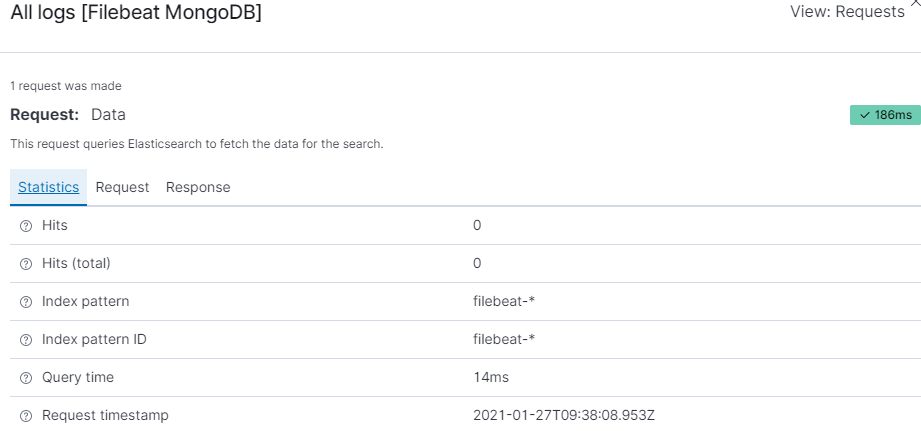
When inspecting the request invoked from Kibana dasboard, I always get 0 hints albeit I have many log entries in my index filebeat-7.10.2-mongodb-2021.01.27-000001managed by ilm.
Please help since I do not see anymore direction to investigate further more.
Thanks & Best Regards
Hi @Marius_Dragomir, I noticed your gave some help on a similar case last Sept 2020 ... I just would like to add that I do face the same issue whith nginx dashboard : no data displayed ... Please note that I have a specific index per application I am collecting the logs from : mongodb, nginx, ... :
You may want to ask your beats and ECS questions in the separate Beats forum that we have, monitored by the teams that work on those products.
I can help you with your Discover question, which has a simple answer: alias type fields, and multi-mapped fields in general, are not shown in Discover. We have recently merged changes to this which will get rolled out in future versions of the stack, but for now this is expected behavior.
I can't help you understand why there are 2 similar dashboards, but it seems like one of these 2 things is true:
a. Maybe one of the dashboards was carried over from previous versions of filebeat
b. Maybe this is intentional and filebeat expects you to analyze the data in 2 different ways
Thanks for your supprot @wylie . I guess option a. Maybe one of the dashboards was carried over from previous versions of filebeat is the good one. I gonna try to retag my case as Beat to get Beats experts feedbacks.
Apache, Apache Lucene, Apache Hadoop, Hadoop, HDFS and the yellow elephant
logo are trademarks of the
Apache Software Foundation
in the United States and/or other countries.