I'm using metricbeat to push my application metrics to elasticsearch and then visualize it in Kibana. Metricbeat pushes metrics every 10 seconds to elasticsearch. My application is pushing count metric with different labels related to a business use-case. I've a requirement of visualising the increment in this count value between given time interval. This difference can be visualised as total as well as seggregated by label.
In Kibana's Visual Builder, I tried using sum aggregation/ derivative / count but none of them are giving me correct value. Need help regarding this.
NOTE - Another issue in this metric is that the count gets reset to 0 sometimes due to node going down. Is there any way to handle this scenario to give correct difference?
From the sounds of it, derivative is what you're looking for. Do you have an example of the data you can provide?
In terms of handling the 0 count, I am not sure about this. Is there any way to handle prevent sending this data, or is it useful for other metrics? Maybe you could add a field for if it was down or not so it could be filtered out.
Metrics produced the by applications looks something like this -
"prometheus": {
      "labels": {
        "label": "value1",
        "instance": "xx.xx.xx.xx",
        "job": "jobId",
        "monitor": "VCP_OLD_Processor_Monitor"
      },
      "metrics": {
        "business_metric_1_count_total": 79,
        "business_metric_1_failed_count_total": 198,
        "business_metric_2_failed_count_total": 4,
        "business_metric_1_success_count_total": 67185,
        "business_metric_2_success_count_total": 33594
      }
    }
You can consider the labels object as dimension across which the counts are obtained. So we need to calculate the total increment in count across all dimensions as well increment in count across a selected dimension.
Yea. I tried derivative but that is not giving me correct value. In the visual builder, I first calculated the sum of metrics and then calculated the derivative. But for derivative, you have to select time interval. This gives increment or decrement of values as a time series. This is not what I want.
0 count is not a useful metric. The counter just resets whenever the application is restarted or deployed. So we can't avoid this change as well.
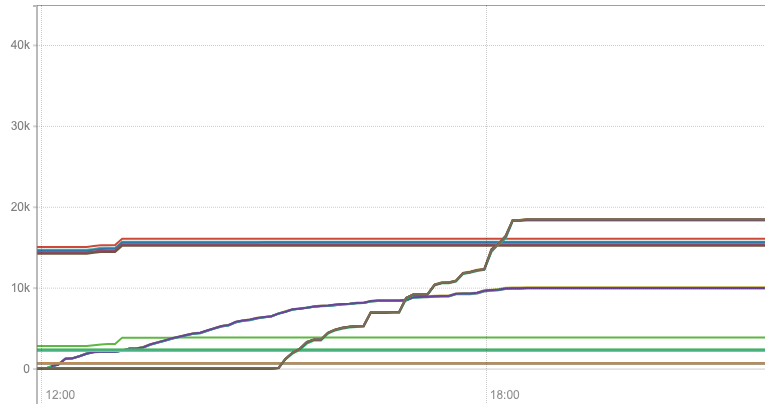
I've added the live graph for the counts from multiple instances. In ideal scenario, the graphs should be increasing but due to restarts and other issues, the count is getting rest and suddenly dropping.