Monitoring still contains the historic data of the indices for as long as the configured retention period. You can set the retention period using the xpack.monitoring.history.duration setting in the monitoring settings. It defaults to 7 days.
Would it be possible for you to provide the result of running
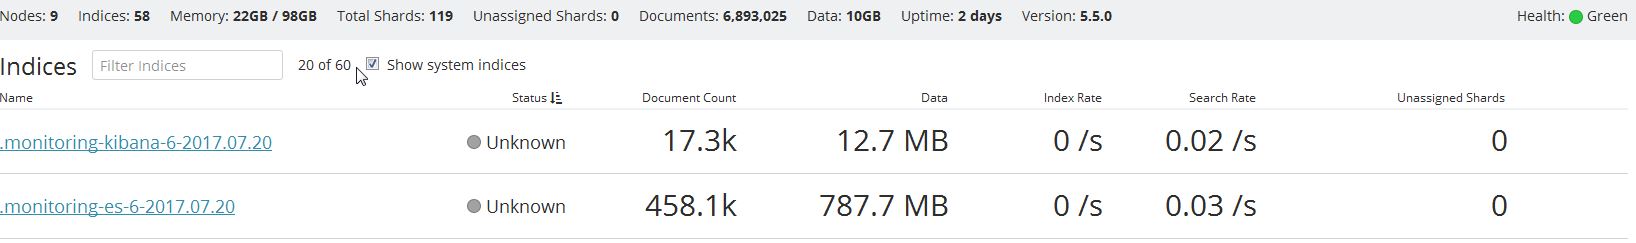
Sure, here are the results (everything is green, but the error remains on the cluster monitoring page):
_cat/health?v epoch timestamp cluster status node.total node.data shards pri relo init unassign pending_tasks max_task_wait_time active_shards_percent 1501596950 16:15:50 ES-PP-APPS green 9 5 143 73 0 0 0 0 - 100.0%
_cat/indices?v health status index uuid pri rep docs.count docs.deleted store.size pri.store.size green open .monitoring-alerts-6 NptlQtWqRrOHaS0Fm5SApQ 1 1 2 0 25.4kb 12.7kb green open .watcher-history-3-2017.07.25 bpsA0p_ySW-43PA7QIbUOw 1 1 5760 0 10.8mb 5.4mb green open .monitoring-kibana-2-2017.07.17 PBPPHbnASACxXnxE-sxGGg 1 1 8514 0 3.4mb 1.7mb green open .watcher-history-3-2017.07.16 sbjLMoQ-QSWGMLvMDajlDQ 1 1 5760 0 10.1mb 5mb green open .monitoring-kibana-2-2017.07.11 5RdeTTqvRZaEoBmZ9zugKg 1 1 17277 0 6.7mb 3.3mb green open .watcher-history-3-2017.07.13 8Em7D23OTjC8KkFL-yBZLg 1 1 5760 0 9.4mb 4.7mb green open .monitoring-es-2-2017.07.14 BBmn65ZtR0yBrDUxOUL8Tg 1 1 362985 520 469mb 234.4mb green open .watcher-history-3-2017.07.21 hc1mGZ0bQIewxiTWAV_jJg 1 1 5760 0 10.9mb 5.4mb green open .watcher-history-3-2017.07.14 9z9WRACGTIm5eNOtQG1cUA 1 1 5760 0 9.3mb 4.6mb green open .monitoring-alerts-2 vkPTcaDqQTiujt-0hlO13A 1 1 1 0 13.8kb 6.9kb green open .watcher-history-3-2017.07.19 Y94C_VJjTfaK6o49yPxrUA 1 1 5760 0 10.4mb 5.2mb green open .monitoring-kibana-2-2017.07.13 RpUzZEujRyOG4C3ndBVzlQ 1 1 17278 0 6.7mb 3.3mb green open .kibana iWdcOaZDQCWjuDvDjLjrwQ 1 1 3 0 22.5kb 11.2kb green open .monitoring-kibana-6-2017.08.01 ytOaJTZsTPK0I2SyrajorA 1 1 6777 0 5.6mb 2.8mb green open .security rXB8zjESTDyhJmMZe9G77Q 1 4 3 0 55.2kb 11kb green open .monitoring-es-6-2017.07.27 YZ6m5GvARLKrQ5RUXSnsNw 1 1 596852 1138 1gb 522.9mb green open .monitoring-es-2-2017.07.13 mMM3k7F4RjSj_ifdCiK8AQ 1 1 337022 374 423mb 211.5mb green open .watcher-history-3-2017.07.28 vRs49IttTT2gZPso0mWuww 1 1 5770 0 16.2mb 8mb green open .monitoring-kibana-6-2017.07.28 BMfG1LAlTSaUlAOalePmSw 1 1 17244 0 14.1mb 7mb green open .watcher-history-3-2017.07.29 MWlQ_qCHTBu_sQvSmlmZ5g 1 1 5760 0 11mb 5.4mb green open .triggered_watches vXs9YhSuRNuEpX0Web8TyA 1 1 0 0 27mb 13.5mb green open .monitoring-kibana-6-2017.07.30 61nH9frMRtK6XPC7P9BUtg 1 1 17278 0 13.2mb 6.6mb green open .watcher-history-3-2017.07.18 XcF_Ob8mT2i7t41NTTCxuw 1 1 5760 0 10.6mb 5.3mb green open .monitoring-es-6-2017.07.28 V_qHpgVCSyeuyzkKO_zUvg 1 1 608930 1412 1015.1mb 507mb green open .monitoring-es-6-2017.07.26 m3alztLLRKaUrmJmLzUzFQ 1 1 587859 1122 1gb 519.9mb green open .monitoring-kibana-6-2017.07.29 bOzvCWhcQ2eipdHudt5XlQ 1 1 17278 0 13.3mb 6.6mb green open .watcher-history-3-2017.07.20 gufQUow3T6SLAJe0ytnmVw 1 1 5760 0 11.1mb 5.5mb green open .monitoring-es-2-2017.07.17 9VJQmD9rT5mR_UWJvIZjUg 1 1 219225 244118 417.9mb 208.9mb green open .monitoring-kibana-6-2017.07.25 XE7yq0DwRC2stVtfQ53kZA 1 1 17278 0 13.4mb 6.7mb green open .watcher-history-3-2017.07.27 eZ4xszmQSpuid4xO5flJWg 1 1 5757 0 11.2mb 5.6mb green open .monitoring-es-2-2017.07.16 hwoQmHoRTlyUWnvwD00mqg 1 1 414866 364 529.6mb 264.4mb green open .watcher-history-3-2017.07.15 11JSWg1aQdG3Tl_-XqfCKQ 1 1 5760 0 9.5mb 4.7mb green open .monitoring-kibana-2-2017.07.16 vxQC2UJMQIuQWEy5F3mygw 1 1 17278 0 6.6mb 3.3mb green open .monitoring-es-2-2017.07.10 G7KEIO5qT-KV2H7iiNki6Q 1 1 113836 80 130.1mb 65mb green open .monitoring-es-2-2017.07.11 X-9E1gj_TqKVfobMmYJI5A 1 1 285176 220 322.8mb 161.4mb green open .watcher-history-3-2017.07.31 ckUfvjXJQ22oLQEJ8pFAmg 1 1 5760 0 10.8mb 5.3mb green open .watcher-history-3-2017.07.17 6qBLwyJyQu2R9Xt0n6ef8w 1 1 5773 0 11.2mb 5.6mb green open .watches KwEaxzitRh-8WWOhQYXwOw 1 1 4 0 46.2kb 23.1kb green open .watcher-history-3-2017.07.11 U-viBjv6TdivHcAZrpEqNw 1 1 5760 0 10.1mb 4.9mb green open .watcher-history-3-2017.07.22 HIVAk87DQ8ihxbs995cqwg 1 1 5760 0 11mb 5.5mb green open .monitoring-kibana-6-2017.07.27 HUUZXsxLTmCmaI1_yaUSsw 1 1 17274 0 13.8mb 6.9mb green open .monitoring-kibana-6-2017.07.31 QNo2mMWMQv-Mkdjqhwdr3w 1 1 14363 0 11.5mb 5.7mb green open .monitoring-data-2 vuCMWqLRT-i99rd2LEC9RA 1 1 12 0 22.4kb 11.2kb green open .watcher-history-3-2017.07.12 qFds2C8yQdCcJ_SiPDOPAQ 1 1 5760 0 9.7mb 4.7mb
... green open .monitoring-kibana-2-2017.07.15 s--r1-c1SF2DDL3DKCu-uA 1 1 17277 0 6.6mb 3.3mb green open .monitoring-es-6-2017.07.31 A8NxISDtRq-f20zzE4H5Fg 1 1 636545 1610 1gb 529.8mb green open .monitoring-es-6-2017.08.01 ylBL_FdGRMy2paUpm7S8xw 1 1 390517 1713 669.2mb 329.9mb
Apache, Apache Lucene, Apache Hadoop, Hadoop, HDFS and the yellow elephant
logo are trademarks of the
Apache Software Foundation
in the United States and/or other countries.