Hello,
Any help is much appreciated in advance
Kibana version:
8.3.2
Elasticsearch version:
8.3.2
APM Server version:
8.3.2
APM Agent language and version:
8.3.2
Browser version:
N/A
Original install method (e.g. download page, yum, deb, from source, etc.) and version:
Docker containers
Fresh install or upgraded from other version?
Fresh
Is there anything special in your setup? For example, are you using the Logstash or Kafka outputs? Are you using a load balancer in front of the APM Servers? Have you changed index pattern, generated custom templates, changed agent configuration etc.
No, just basic initial configuration
Description of the problem including expected versus actual behavior. Please include screenshots (if relevant):
I'm trying to get the elk stack running locally on docker desktop for test purposes. I've setup Elasticsearch, kibana, and the fleet server apm agent containers. Elasticsearch and kibana seem to be running properly. The fleet server was able to connect to kibana and I was able to setup an integration. I've got a simple asp.net 6 web application that is trying to send its logging information to the apm fleet server. It simply cannot connect and I don't know why. I've tried port 8200, port 8220, and port 8307 since that's where I've setup the integration. I created a docker compose file for the elastic agent to make things easier for myself:
version: '3.4'

services:
  fleet-server:
    image: docker.elastic.co/beats/elastic-agent:8.3.2
    ports:
      - 8200:8200
      - 8220:8220
      - 8307:8307
    environment:
      FLEET_SERVER_ENABLE: "true"
      FLEET_SERVER_ELASTICSEARCH_HOST: "http://elasticsearch:9200"
      FLEET_SERVER_SERVICE_TOKEN: "AAEAAWVsYXN0aWMvZmxlZXQtc2VydmVyL3Rva2VuLTE2NTgxOTU1NTY3MTM6QVpGZGtfX1pTTUdzc1pidi1kWkdYZw"
      FLEET_SERVER_POLICY_ID: "fleet-server-policy"
networks:
  default:
    name: elk
    external: true
I've tried the trouble shooting guide but says nothing about a response ended prematurely error.
Diagnostics did not provide any additional information:

Curling status on the various port doesn't seem to do anything:

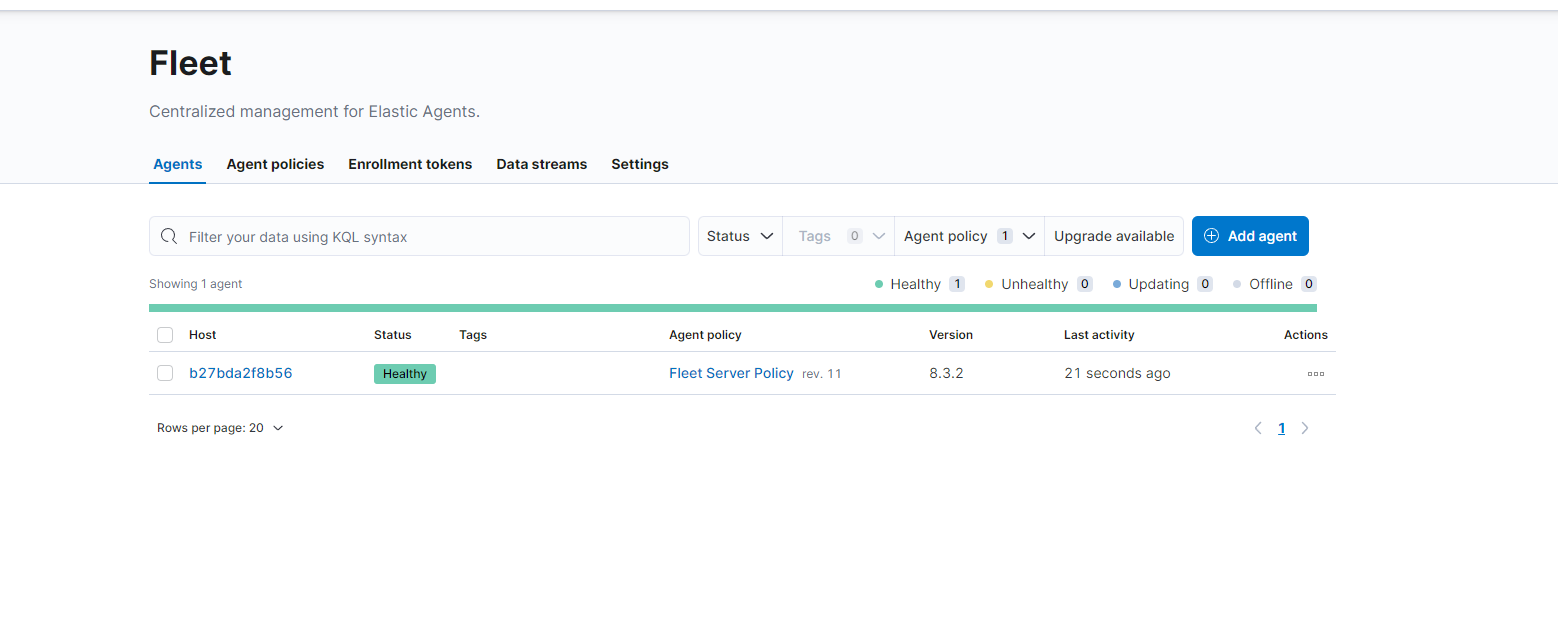
But fleet server says healthy:
Here are some logs from the fleet server:
15:46:41.283
elastic_agent
[elastic_agent][info] APM instrumentation disabled
15:46:41.283
elastic_agent
[elastic_agent][info] APM instrumentation disabled
15:46:41.285
elastic_agent
[elastic_agent][info] Detecting execution mode
15:46:41.285
elastic_agent
[elastic_agent][info] Agent is managed locally
15:46:41.285
elastic_agent
[elastic_agent][info] capabilities file not found in /usr/share/elastic-agent/state/capabilities.yml
15:46:41.285
elastic_agent
[elastic_agent][info] Detecting execution mode
15:46:41.285
elastic_agent
[elastic_agent][info] Agent is managed locally
15:46:41.285
elastic_agent
[elastic_agent][info] capabilities file not found in /usr/share/elastic-agent/state/capabilities.yml
15:46:41.660
elastic_agent
[elastic_agent][info] Docker provider skipped, unable to connect: Cannot connect to the Docker daemon at unix:///var/run/docker.sock. Is the docker daemon running?
15:46:41.660
elastic_agent
[elastic_agent][info] Docker provider skipped, unable to connect: Cannot connect to the Docker daemon at unix:///var/run/docker.sock. Is the docker daemon running?
15:46:41.661
elastic_agent
[elastic_agent][info] Starting stats endpoint
15:46:41.661
elastic_agent
[elastic_agent][info] Agent is starting
15:46:41.661
elastic_agent
[elastic_agent][info] Metrics endpoint listening on: /usr/share/elastic-agent/state/data/tmp/elastic-agent.sock (configured: unix:///usr/share/elastic-agent/state/data/tmp/elastic-agent.sock)
15:46:41.661
elastic_agent
[elastic_agent][info] Starting stats endpoint
15:46:41.661
elastic_agent
[elastic_agent][info] Agent is starting
15:46:41.661
elastic_agent
[elastic_agent][info] Metrics endpoint listening on: /usr/share/elastic-agent/state/data/tmp/elastic-agent.sock (configured: unix:///usr/share/elastic-agent/state/data/tmp/elastic-agent.sock)
15:46:41.662
elastic_agent
[elastic_agent][info] Agent is stopped
15:46:41.662
elastic_agent
[elastic_agent][info] Configuration changes detected
15:46:41.662
elastic_agent
[elastic_agent][info] Agent is stopped
15:46:41.662
elastic_agent
[elastic_agent][info] Configuration changes detected
15:46:41.665
elastic_agent
[elastic_agent][info] New State ID is euIJiNoY
15:46:41.665
elastic_agent
[elastic_agent][info] Converging state requires execution of 2 step(s)
15:46:41.665
elastic_agent
[elastic_agent][info] New State ID is euIJiNoY
15:46:41.665
elastic_agent
[elastic_agent][info] Converging state requires execution of 2 step(s)
15:46:41.894
elastic_agent
[elastic_agent][info] operation 'operation-install' skipped for metricbeat.8.3.2
15:46:41.894
elastic_agent
[elastic_agent][info] operation 'operation-install' skipped for metricbeat.8.3.2
15:46:41.995
elastic_agent
[elastic_agent][info] 2022-07-18T21:46:41Z - message: Application: metricbeat--8.3.2[9b146426-bfff-411c-98cc-f115d1450fd2]: State changed to STARTING: Starting - type: 'STATE' - sub_type: 'STARTING'
15:46:41.995
elastic_agent
[elastic_agent][info] 2022-07-18T21:46:41Z - message: Application: metricbeat--8.3.2[9b146426-bfff-411c-98cc-f115d1450fd2]: State changed to STARTING: Starting - type: 'STATE' - sub_type: 'STARTING'
15:46:42.188
elastic_agent
[elastic_agent][info] operation 'operation-install' skipped for filebeat.8.3.2
15:46:42.188
elastic_agent
[elastic_agent][info] operation 'operation-install' skipped for filebeat.8.3.2
15:46:42.241
elastic_agent
[elastic_agent][info] 2022-07-18T21:46:42Z - message: Application: filebeat--8.3.2--36643631373035623733363936343635[9b146426-bfff-411c-98cc-f115d1450fd2]: State changed to STARTING: Starting - type: 'STATE' - sub_type: 'STARTING'
15:46:42.241
elastic_agent
[elastic_agent][info] 2022-07-18T21:46:42Z - message: Application: filebeat--8.3.2--36643631373035623733363936343635[9b146426-bfff-411c-98cc-f115d1450fd2]: State changed to STARTING: Starting - type: 'STATE' - sub_type: 'STARTING'
15:46:42.364
elastic_agent.metricbeat
[elastic_agent.metricbeat][info] Home path: [/usr/share/elastic-agent/data/elastic-agent-16c55b/install/metricbeat-8.3.2-linux-x86_64] Config path: [/usr/share/elastic-agent/data/elastic-agent-16c55b/install/metricbeat-8.3.2-linux-x86_64] Data path: [/usr/share/elastic-agent/state/data/run/default/metricbeat--8.3.2] Logs path: [/usr/share/elastic-agent/data/elastic-agent-16c55b/install/metricbeat-8.3.2-linux-x86_64/logs]
15:46:42.377
elastic_agent.metricbeat
[elastic_agent.metricbeat][info] Beat ID: 242b4a4e-0fd7-4bf2-a369-0b56a0368f8d
15:46:42.377
elastic_agent.metricbeat
[elastic_agent.metricbeat][info] Beat ID: 242b4a4e-0fd7-4bf2-a369-0b56a0368f8d
15:46:42.378
elastic_agent.metricbeat
[elastic_agent.metricbeat][info] Set gc percentage to: 100
15:46:42.378
elastic_agent.metricbeat
[elastic_agent.metricbeat][info] Set gc percentage to: 100
15:46:42.381
elastic_agent.metricbeat
[elastic_agent.metricbeat][warn] read token request for getting IMDSv2 token returns empty: Put "http://169.254.169.254/latest/api/token": dial tcp 169.254.169.254:80: connect: connection refused. No token in the metadata request will be used.
15:46:42.381
elastic_agent.metricbeat
[elastic_agent.metricbeat][warn] read token request for getting IMDSv2 token returns empty: Put "http://169.254.169.254/latest/api/token": dial tcp 169.254.169.254:80: connect: connection refused. No token in the metadata request will be used.
15:46:42.384
elastic_agent.metricbeat
[elastic_agent.metricbeat][info] Starting stats endpoint
15:46:42.384
elastic_agent.metricbeat
[elastic_agent.metricbeat][info] Metrics endpoint listening on: /usr/share/elastic-agent/state/data/tmp/default/metricbeat/metricbeat.sock (configured: unix:///usr/share/elastic-agent/state/data/tmp/default/metricbeat/metricbeat.sock)
15:46:42.384
elastic_agent.metricbeat
[elastic_agent.metricbeat][info] Syscall filter successfully installed
15:46:42.384
elastic_agent.metricbeat
[elastic_agent.metricbeat][info] add_cloud_metadata: hosting provider type not detected.
15:46:42.384
elastic_agent.metricbeat
[elastic_agent.metricbeat][info] Starting stats endpoint
15:46:42.384
elastic_agent.metricbeat
[elastic_agent.metricbeat][info] Metrics endpoint listening on: /usr/share/elastic-agent/state/data/tmp/default/metricbeat/metricbeat.sock (configured: unix:///usr/share/elastic-agent/state/data/tmp/default/metricbeat/metricbeat.sock)
15:46:42.384
elastic_agent.metricbeat
[elastic_agent.metricbeat][info] Syscall filter successfully installed
15:46:42.384
elastic_agent.metricbeat
[elastic_agent.metricbeat][info] add_cloud_metadata: hosting provider type not detected.
15:46:42.385
elastic_agent.metricbeat
[elastic_agent.metricbeat][info] Beat info
15:46:42.385
elastic_agent.metricbeat
[elastic_agent.metricbeat][info] Build info
15:46:42.385
elastic_agent.metricbeat
[elastic_agent.metricbeat][info] Go runtime info
15:46:42.385
elastic_agent.metricbeat
[elastic_agent.metricbeat][info] Host info
15:46:42.385
elastic_agent.metricbeat
[elastic_agent.metricbeat][info] Process info
15:46:42.385
elastic_agent.metricbeat
[elastic_agent.metricbeat][info] Setup Beat: metricbeat; Version: 8.3.2
15:46:42.385
elastic_agent.metricbeat
[elastic_agent.metricbeat][info] Beat info
15:46:42.385
elastic_agent.metricbeat
[elastic_agent.metricbeat][info] Build info
15:46:42.385
elastic_agent.metricbeat
[elastic_agent.metricbeat][info] Go runtime info
15:46:42.385
elastic_agent.metricbeat
[elastic_agent.metricbeat][info] Host info
15:46:42.385
elastic_agent.metricbeat
[elastic_agent.metricbeat][info] Process info
15:46:42.385
elastic_agent.metricbeat
[elastic_agent.metricbeat][info] Setup Beat: metricbeat; Version: 8.3.2
15:46:42.388
elastic_agent.metricbeat
[elastic_agent.metricbeat][info] elasticsearch url: http://localhost:9200
15:46:42.388
elastic_agent.metricbeat
[elastic_agent.metricbeat][info] elasticsearch url: http://localhost:9200
15:46:42.389
elastic_agent.metricbeat
[elastic_agent.metricbeat][info] Beat name: 7b5af76de64f
15:46:42.389
elastic_agent.metricbeat
[elastic_agent.metricbeat][info] Beat name: 7b5af76de64f
15:46:42.440
elastic_agent.metricbeat
[elastic_agent.metricbeat][info] Starting metrics logging every 30s
15:46:42.440
elastic_agent.metricbeat
[elastic_agent.metricbeat][info] metricbeat start running.
15:46:42.440
elastic_agent.metricbeat
[elastic_agent.metricbeat][warn] BETA: Fleet management is enabled
15:46:42.440
elastic_agent.metricbeat
[elastic_agent.metricbeat][info] Starting metrics logging every 30s
15:46:42.440
elastic_agent.metricbeat
[elastic_agent.metricbeat][info] metricbeat start running.
15:46:42.440
elastic_agent.metricbeat
[elastic_agent.metricbeat][warn] BETA: Fleet management is enabled
15:46:42.442
elastic_agent.metricbeat
[elastic_agent.metricbeat][info] Starting fleet management service
15:46:42.442
elastic_agent.metricbeat
[elastic_agent.metricbeat][info] Starting fleet management service
15:46:42.443
elastic_agent.metricbeat
[elastic_agent.metricbeat][info] Ready to receive configuration
15:46:42.443
elastic_agent.metricbeat
[elastic_agent.metricbeat][info] Ready to receive configuration
15:46:42.494
elastic_agent
[elastic_agent][info] operation 'operation-install' skipped for metricbeat.8.3.2
15:46:42.494
elastic_agent
[elastic_agent][info] operation 'operation-install' skipped for metricbeat.8.3.2
15:46:42.603
elastic_agent
[elastic_agent][info] 2022-07-18T21:46:42Z - message: Application: metricbeat--8.3.2--36643631373035623733363936343635[9b146426-bfff-411c-98cc-f115d1450fd2]: State changed to STARTING: Starting - type: 'STATE' - sub_type: 'STARTING'
15:46:42.603
elastic_agent
[elastic_agent][info] 2022-07-18T21:46:42Z - message: Application: metricbeat--8.3.2--36643631373035623733363936343635[9b146426-bfff-411c-98cc-f115d1450fd2]: State changed to STARTING: Starting - type: 'STATE' - sub_type: 'STARTING'
15:46:42.604
elastic_agent
[elastic_agent][info] Updating internal state
15:46:42.604
elastic_agent
[elastic_agent][info] Updating internal state
15:46:42.605
elastic_agent
[elastic_agent][info] No configuration change
15:46:42.605
elastic_agent
[elastic_agent][info] No configuration change
15:46:42.607
elastic_agent
[elastic_agent][info] New State ID is euIJiNoY
15:46:42.607
elastic_agent
[elastic_agent][info] Converging state requires execution of 0 step(s)
15:46:42.607
elastic_agent
[elastic_agent][info] Updating internal state
15:46:42.607
elastic_agent
[elastic_agent][info] New State ID is euIJiNoY
15:46:42.607
elastic_agent
[elastic_agent][info] Converging state requires execution of 0 step(s)
15:46:42.607
elastic_agent
[elastic_agent][info] Updating internal state
15:46:42.951
elastic_agent.metricbeat
[elastic_agent.metricbeat][info] Status change to Configuring: Updating configuration
15:46:42.951
elastic_agent.metricbeat
[elastic_agent.metricbeat][info] Status change to Configuring: Updating configuration
15:46:42.952
elastic_agent.metricbeat
[elastic_agent.metricbeat][info] Applying settings for metricbeat.modules
15:46:42.952
elastic_agent.metricbeat
[elastic_agent.metricbeat][info] Applying settings for metricbeat.modules
15:46:42.953
elastic_agent.metricbeat
[elastic_agent.metricbeat][info] initializing HostFS values under agent: /
15:46:42.953
elastic_agent.metricbeat
[elastic_agent.metricbeat][info] initializing HostFS values under agent: /
15:46:42.953
elastic_agent.metricbeat
[elastic_agent.metricbeat][info] initializing HostFS values under agent: /
15:46:42.953
elastic_agent.metricbeat
[elastic_agent.metricbeat][info] initializing HostFS values under agent: /
15:46:42.953
elastic_agent.metricbeat
[elastic_agent.metricbeat][info] Ignoring filesystem types: sysfs, tmpfs, bdev, proc, cgroup, cgroup2, cpuset, devtmpfs, binfmt_misc, debugfs, tracefs, sockfs, bpf, pipefs, ramfs, hugetlbfs, rpc_pipefs, devpts, nfs, nfs4, nfsd, cifs, smb3, autofs, fuse, fusectl, virtiofs, overlay, 9p, ceph, mqueue
15:46:42.953
elastic_agent.metricbeat
[elastic_agent.metricbeat][info] initializing HostFS values under agent: /
15:46:42.953
elastic_agent.metricbeat
[elastic_agent.metricbeat][info] initializing HostFS values under agent: /
15:46:42.953
elastic_agent.metricbeat
[elastic_agent.metricbeat][info] initializing HostFS values under agent: /
15:46:42.953
elastic_agent.metricbeat
[elastic_agent.metricbeat][info] initializing HostFS values under agent: /
15:46:42.953
elastic_agent.metricbeat
[elastic_agent.metricbeat][info] Ignoring filesystem types: sysfs, tmpfs, bdev, proc, cgroup, cgroup2, cpuset, devtmpfs, binfmt_misc, debugfs, tracefs, sockfs, bpf, pipefs, ramfs, hugetlbfs, rpc_pipefs, devpts, nfs, nfs4, nfsd, cifs, smb3, autofs, fuse, fusectl, virtiofs, overlay, 9p, ceph, mqueue
15:46:42.954
elastic_agent.metricbeat
[elastic_agent.metricbeat][info] Applying settings for output
15:46:42.954
elastic_agent.metricbeat
[elastic_agent.metricbeat][info] elasticsearch url: http://elasticsearch:9200
15:46:42.954
elastic_agent.metricbeat
[elastic_agent.metricbeat][info] Applying settings for output
15:46:42.954
elastic_agent.metricbeat
[elastic_agent.metricbeat][info] elasticsearch url: http://elasticsearch:9200
15:46:43.450
elastic_agent
[elastic_agent][info] 2022-07-18T21:46:43Z - message: Application: metricbeat--8.3.2[9b146426-bfff-411c-98cc-f115d1450fd2]: State changed to RUNNING: Running - type: 'STATE' - sub_type: 'RUNNING'
15:46:43.450
elastic_agent
[elastic_agent][info] 2022-07-18T21:46:43Z - message: Application: metricbeat--8.3.2[9b146426-bfff-411c-98cc-f115d1450fd2]: State changed to RUNNING: Running - type: 'STATE' - sub_type: 'RUNNING'
15:46:43.550
elastic_agent
[elastic_agent][info] 2022-07-18T21:46:43Z - message: Application: filebeat--8.3.2--36643631373035623733363936343635[9b146426-bfff-411c-98cc-f115d1450fd2]: State changed to RUNNING: Running - type: 'STATE' - sub_type: 'RUNNING'
15:46:43.550
elastic_agent
[elastic_agent][info] 2022-07-18T21:46:43Z - message: Application: filebeat--8.3.2--36643631373035623733363936343635[9b146426-bfff-411c-98cc-f115d1450fd2]: State changed to RUNNING: Running - type: 'STATE' - sub_type: 'RUNNING'
15:46:43.763
elastic_agent
[elastic_agent][info] 2022-07-18T21:46:43Z - message: Application: metricbeat--8.3.2--36643631373035623733363936343635[9b146426-bfff-411c-98cc-f115d1450fd2]: State changed to RUNNING: Running - type: 'STATE' - sub_type: 'RUNNING'
15:46:43.763
elastic_agent
[elastic_agent][info] 2022-07-18T21:46:43Z - message: Application: metricbeat--8.3.2--36643631373035623733363936343635[9b146426-bfff-411c-98cc-f115d1450fd2]: State changed to RUNNING: Running - type: 'STATE' - sub_type: 'RUNNING'
Steps to reproduce:
- Setup Elasticsearch and kibana in docker
- Enroll fleet server
- Connect .net application to fleet server container
Errors in browser console (if relevant):
System.Net.Http.HttpRequestException: An error occurred while sending the request.
---> System.IO.IOException: The response ended prematurely.
at System.Net.Http.HttpConnection.SendAsyncCore(HttpRequestMessage request, Boolean async, CancellationToken cancellationToken)
--- End of inner exception stack trace ---
at System.Net.Http.HttpConnection.SendAsyncCore(HttpRequestMessage request, Boolean async, CancellationToken cancellationToken)
at System.Net.Http.HttpConnectionPool.SendWithVersionDetectionAndRetryAsync(HttpRequestMessage request, Boolean async, Boolean doRequestAuth, CancellationToken cancellationToken)
at System.Net.Http.DiagnosticsHandler.SendAsyncCore(HttpRequestMessage request, Boolean async, CancellationToken cancellationToken)
at System.Net.Http.RedirectHandler.SendAsync(HttpRequestMessage request, Boolean async, CancellationToken cancellationToken)
at System.Net.Http.HttpClient.g__Core|83_0(HttpRequestMessage request, HttpCompletionOption completionOption, CancellationTokenSource cts, Boolean disposeCts, CancellationTokenSource pendingRequestsCts, CancellationToken originalCancellationToken)
at Elastic.Apm.Report.PayloadSenderV2.ProcessQueueItems(Object queueItems)
**** Edit:
I finally got the API status working, but intake/v2/events is not working
