Kibana version:7.4.2
Elasticsearch version:74.2
APM Server version:7.4.2
APM Agent language and version: .net , Elastic.Apm.NetCoreAll , 1.5.1
Browser version: chrome, Version 85.0.4183.83 (Official Build) (64-bit)
Original install method (e.g. download page, yum, deb, from source, etc.) and version: docker
Fresh install or upgraded from other version? fresh install
Is there anything special in your setup? For example, are you using the Logstash or Kafka outputs? Are you using a load balancer in front of the APM Servers? Have you changed index pattern, generated custom templates, changed agent configuration etc.
No logstash/kafks, data from elastic.apm agent directly. No custom templates. ServiceUrls and ServiceName configured only under ElasticApm section in appsettings.json, SecretToken is commented out.
Description of the problem including expected versus actual behavior. Please include screenshots (if relevant):
We have elasticsearch 7.4.2 and kibana 7.4.2 installed from docker for system logging and they work fine. I added elastic apm server recently from the docker image and it starts with the service url of the elasticsearch server. From the log, I think the apm server started correctly.

in kibana, I checked apm server status, it was fine

and the agents section, I selected .net tab, and it looked also fine

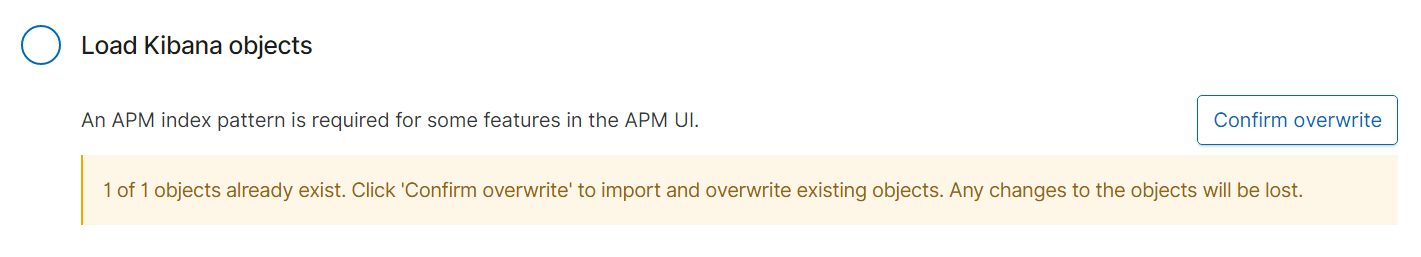
BTW, when loading kibana objects, there was a warning and I overwrote it
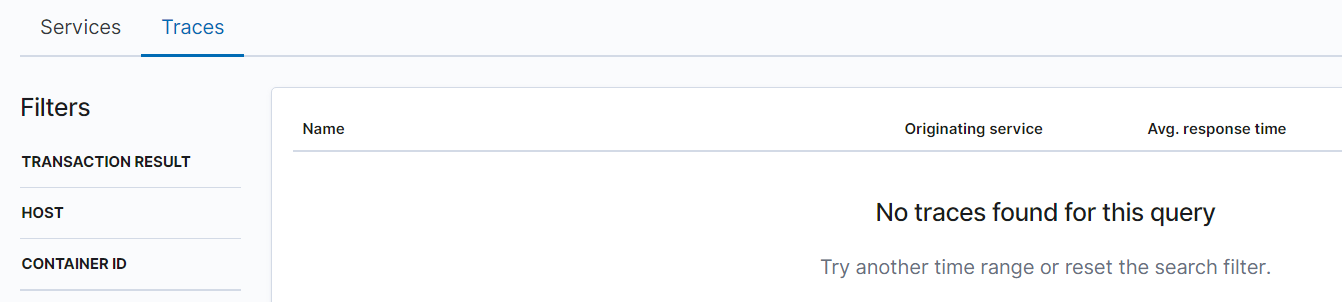
everything looked good and I went to apm doashboard, a few http requests were sent but there was no services found ,not traces

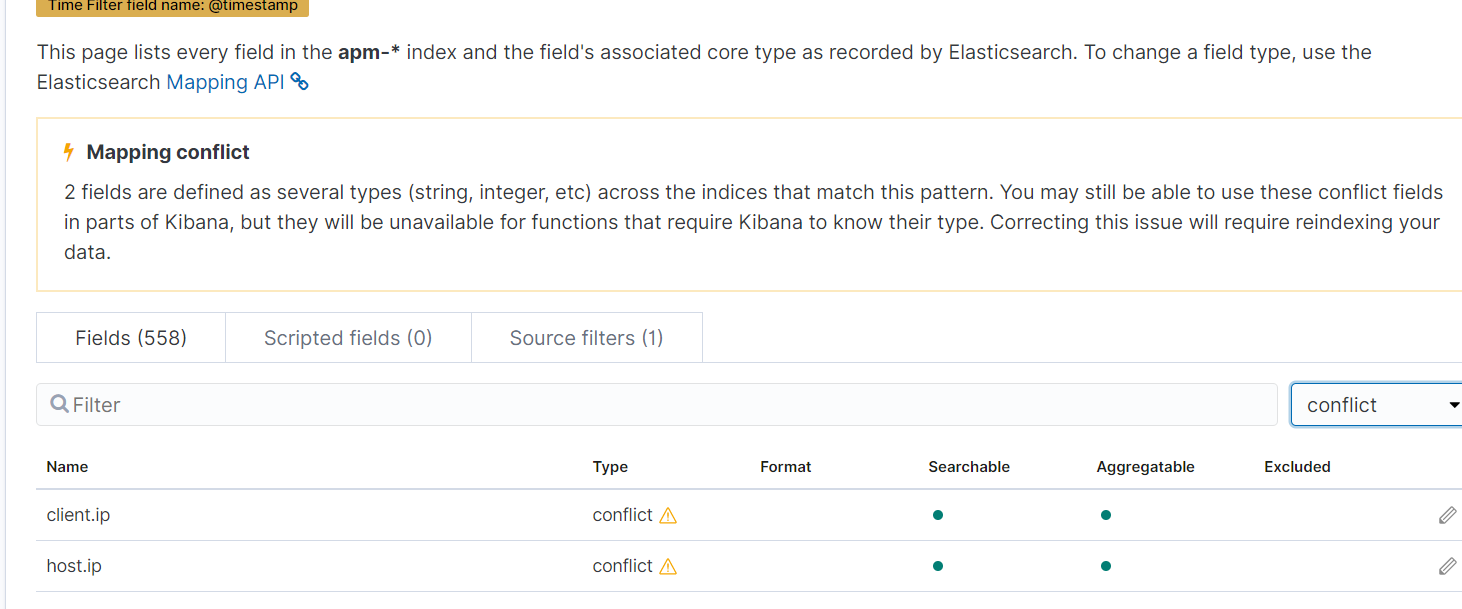
and I could see logs under "apm-*" in discover page
Steps to reproduce:
1.
2.
3.
Errors in browser console (if relevant):
Provide logs and/or server output (if relevant):