the name of script is : test-switch
What I was after is something like this (my script is named logger.sh
$ ls -l logger.sh
-rwx------  1 user  group  147 Apr 13  2017 logger.sh
As you can see the script is executable by user user (because -rwx------).


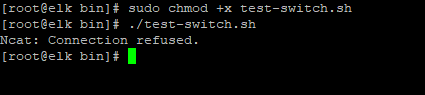
@A_B i must tape chmod +x test-switch.sh ... but when I run the script; connection refused

You have to of corse change the hostname and port in this comment
$ nc -v -z -u logstash.example.com 5515
You did change the port but should it not be 1514 ? If the above comment does not succeed then the script will not work.
You can see if Logstash is listening on port 1514 with this as well
# lsof -n -P -i :1514
That command should return something like
COMMAND   PID     USER   FD   TYPE    DEVICE SIZE/OFF NODE NAME
java    26964 logstash  173u  IPv4 105197915      0t0  UDP *:1514
how i make logstash lestenning in port 1514 ( centos7)
Is Logstash running at all?
As I have written already
# cat logstash.conf
input {
  udp {
    port => 1514
  }
}
filter {}
output {
    stdout { codec => rubydebug }
}

# /path/to/logstash/bin/logstash -f /path/to/logstash.conf
That would start Logstash, listening on UDP port 1514. But that starts Logstash in the foreground so as soon as you exit Logstash stops again...
I do not use Centos so not sure how the Logstash service is managed.
yes i do the same in /etc/logstash/conf.d/switch-cisco.conf

for the installation of ELK under centos 7 server I followed this link
How do you start Logstash? Is it running as a service?

What does cat /etc/logstash/logstash.yml show? Or whatever your main Logstash config file is called...
the file logstash is a big file, the script does not work
What I am trying to find out is what your path.config is set to. Below an example from one of my machines.
---
path.data: "/var/lib/logstash"
path.config: "/etc/logstash/conf.d"
path.logs: "/var/log/logstash"
log.level: warn
dead_letter_queue.enable: true
dead_letter_queue.max_bytes: 10240mb
path.dead_letter_queue: "/var/dead_letter_queue"
pipeline.batch.size: 25
pipeline.batch.delay: 5
As you can see
path.config: "/etc/logstash/conf.d"
For me that folder looks like
# ls -l /etc/logstash/conf.d
total 16
-rw-r----- 1 root logstash 6007 Apr 10 08:27 filter
-rw-r----- 1 root logstash 2246 Nov 23 11:32 input
-rw-r----- 1 root logstash  230 Apr 10 08:27 output
I'm trying to help you figure out if Logstash is actually using your config from above because it sure looks like it is not, because Logstash is not listening on port 1514.

I do not know if you can have several configuration files for different inputs. So I would suggest to at least during troubleshooting to move all inputs to one file.
Try adding the udp input to 02-beats-input.conf
The resulting file should look something like
input {
  beats {
    port => 5044
  }
  udp {
    port => 1514
  }
}
Then restart Logstash and see if it is now listening on port 1514 with lsof.
@A_B you are right ,
I want to know if i have several configuration files for different inputs. it causes problems ?  my goal is to collect the Cisco switch logs and Palo alto firewall,
for the palo alto, I found this link, I followed it but it's not clear to me,
I i don't know for logstash, if I put a single input for several devices, or each device has an input file and filter file and output file, each one apart
This is how my config files are arranged
# ls -l /etc/logstash/conf.d
total 16
-rw-r----- 1 root logstash 6007 Apr 10 08:27 filter
-rw-r----- 1 root logstash 2246 Nov 23 11:32 input
-rw-r----- 1 root logstash  230 Apr 10 08:27 output
One file per config file "section". I have probably 10 inputs, many filters and try to use only one output (although I have used several in the past).
It is your choice if you use more than one input. Personally, I would probably use one for Cisco devices and another one for the Palo Alto devices. This would let you add tags and fields to the inputs that can be very useful in the filter section.
As an example, here is the Logstash input config for the Juniper switch and firewall logs where I work
  # Juniper log JSON input
  syslog {
    port => 5518
    grok_pattern => "%{SYSLOG5424PRI}%{NUMBER:syslog_severity} %{SYSLOGLINE}"
    type => "juniper"
    add_field => {
      "[@metadata][index]" => "juniper"
      "[@metadata][log_prefix]" => "dc"
    }
  }
First of all, Juniper logs are in syslogformat, so the input type is syslog. This input listens on both TCP and UDP according to the documentation.
The portis self-explanatory.
The syslog input allows using grok already on the input which is nice. I the logs were in JSON this would not be necessary.
The type adds a filed which can be used in the filter section but I usually use the added @metadata fields for that.
I also use those @metadata fields for setting Elasticsearch index name.
Having said all that, I would start as simple as possible and add complexity as you go.
so you advise me to put a single input and filter file and output
udp input to 02-beats-input.conf


something was wrong, can be juniper it's not like cisco in the configuration. please there is no guide or tutto for cisco switch log collection with ELK
i am stuck