Packetbeat DNS response time nanoseconds instead of microseconds

Dear All,
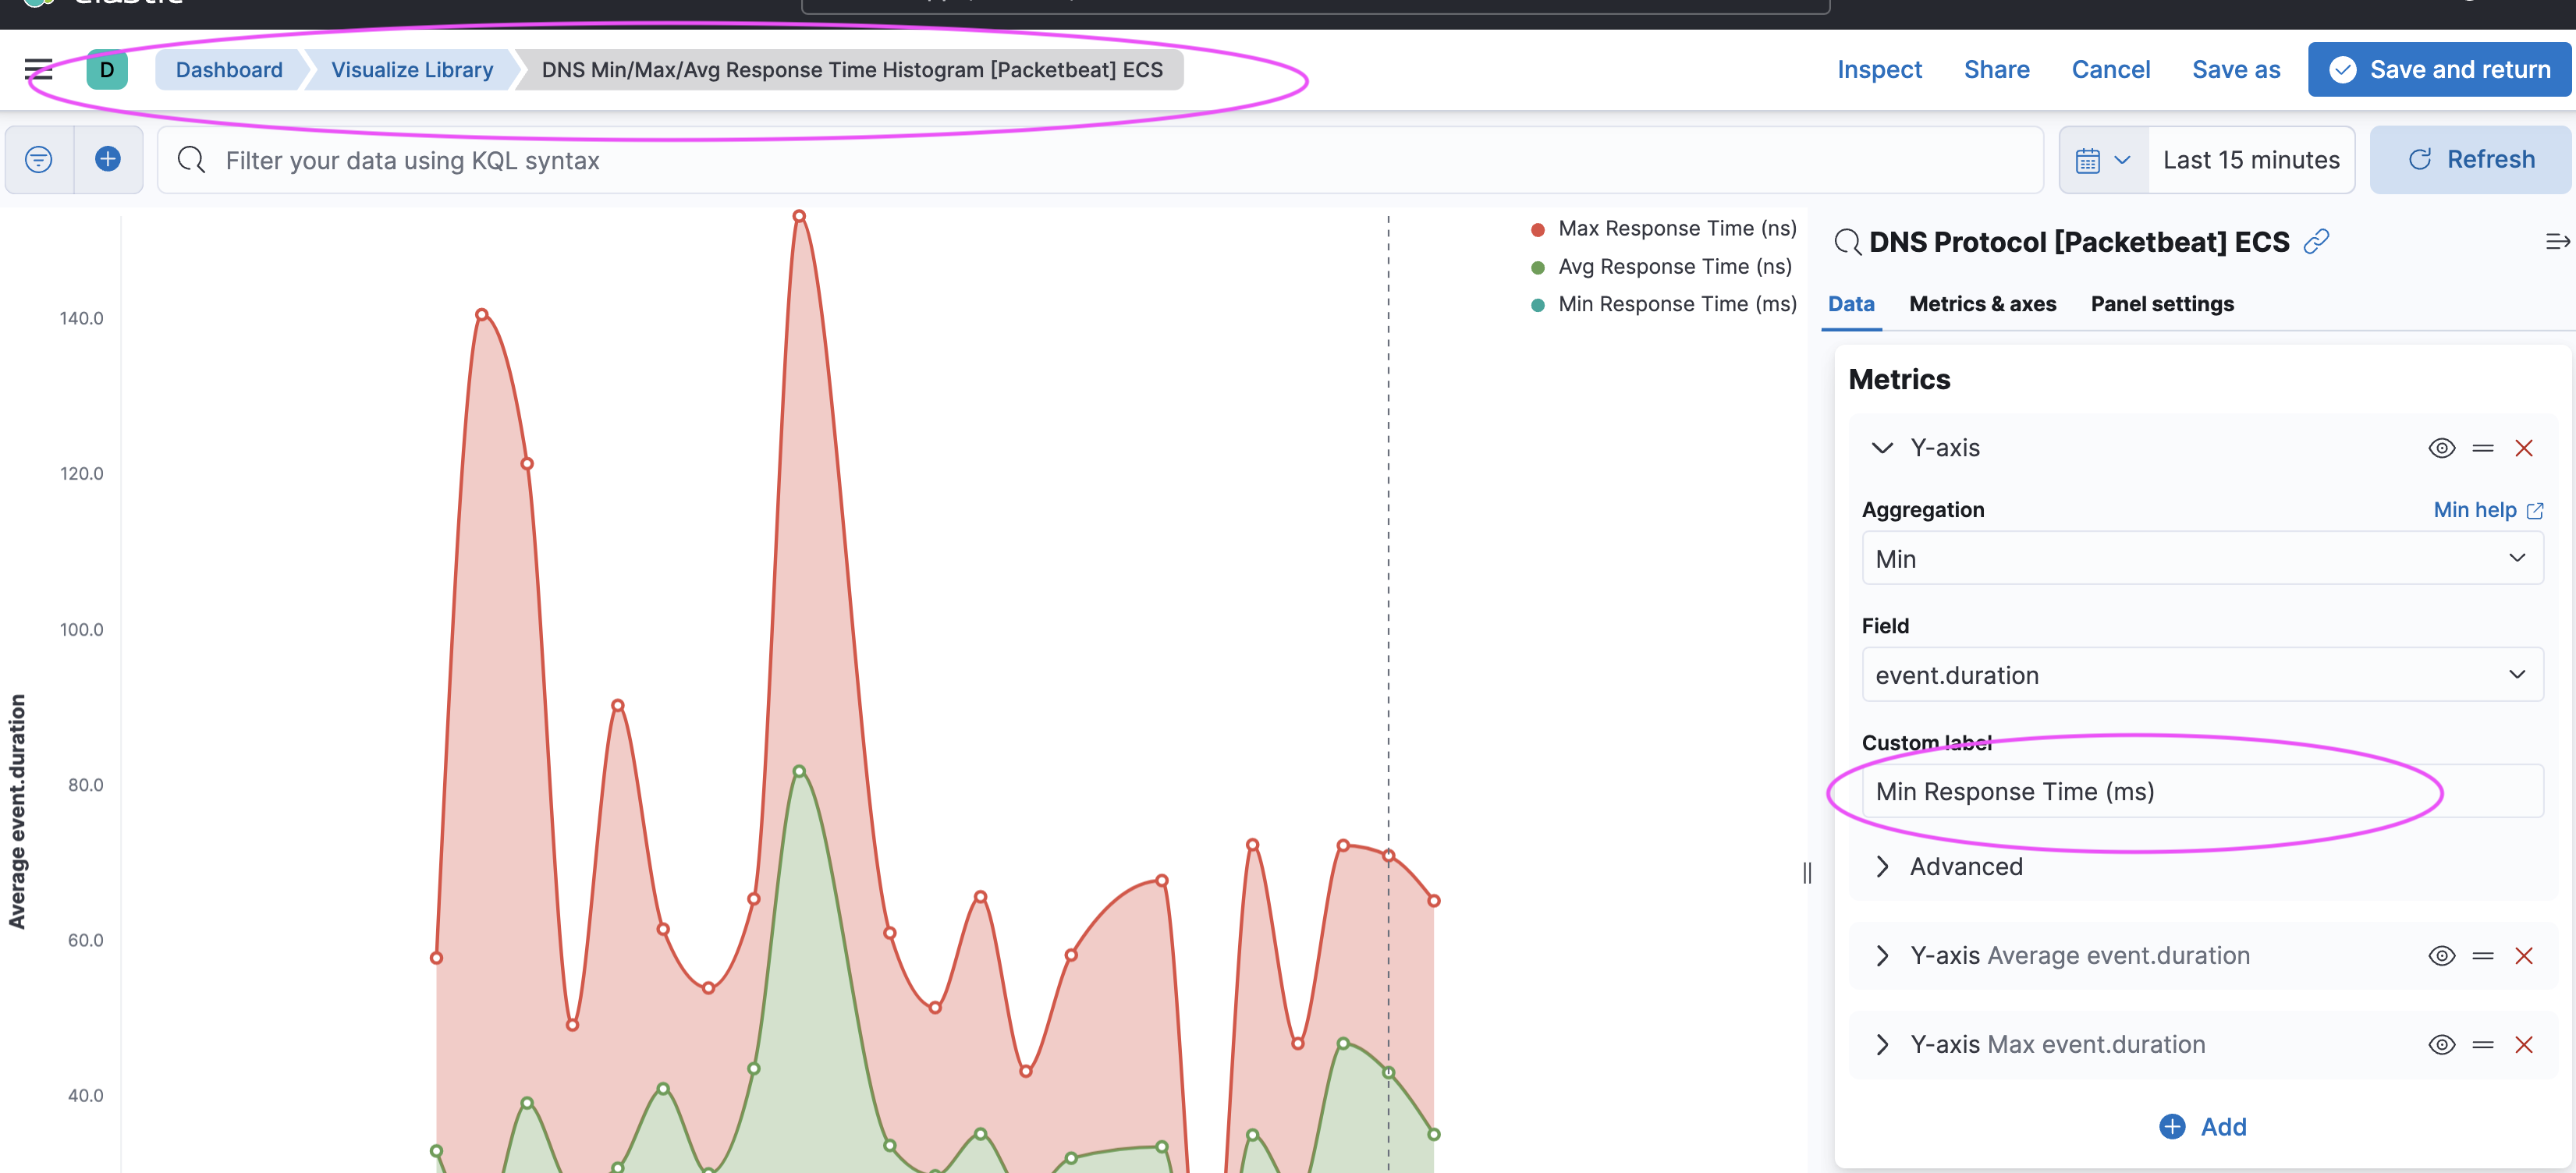
I am running ELK stack 8.4.1 on latest Debian. Kibana/Packetbeat shows nice data in the DNS overview. When I move the mouse at DNS Min/Max/Avg Response Time Histogram over the graph I see for example max response time (ns) 20.
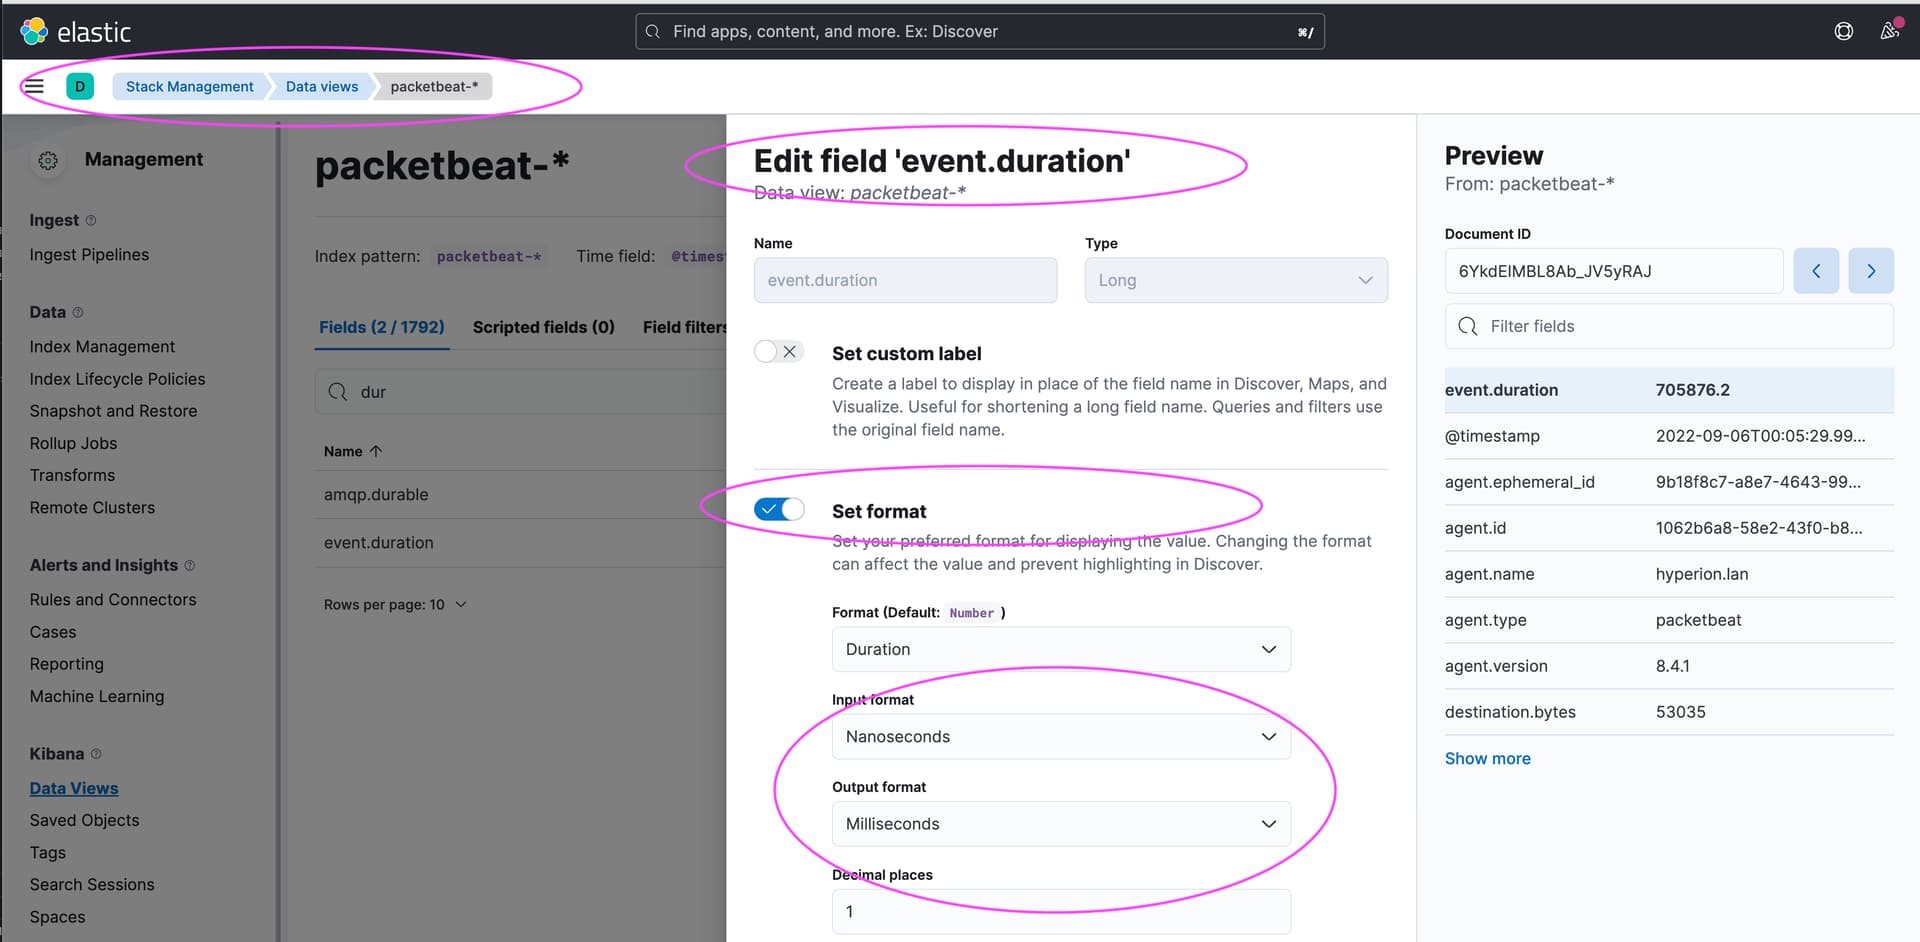
There I am quite sure this can't be nanoseconds, it must be microseconds.
When I wireshark the traffic I see also values in the range of 10 or 100 microseconds. Not sure if a solution down to nanoseconds would be even possible.

Kind regards
Hans

--

Hi @mayer

Can you show us which Visualization / Which Dashboard?

I see it now... hmmm...looking...

Ok Got... It is simply labeled wrong... I was starting to thing there was a major bug...

In the Data View .. .the nanos are converted to ms... so those duration are in fact represented in ms

I suspect the Label in the Default Dashboard never got update to match... with the new setting

So you can just fix the label... by hitting edit on the Dashboard, Edit the Viz and fix the label

And you could enter an issue in the Packet Beat Repo if you like.

I entered an issue here

@mayer Thanks for finding this! :slight_smile:

Hi Stephen,
many thanks for your reply and the hint to fix this issue.
But is it really "ms" ( milliseconds ) ? Or should it be microseconds ( 10^-6 of a second ) ? Indeed I see with Wireshark values between some and hundreds microseconds.

Kind regards
Hans

Hmmm On my box the ms lined up with what I was seeing...

Example

$ dig jetbrains.com
...

;; Query time: 21 msec
;; SERVER: 192.168.2.1#53(192.168.2.1)
;; WHEN: Tue Sep 06 13:30:32 PDT 2022
;; MSG SIZE  rcvd: 106

....
Couple more times

;; Query time: 0 msec
;; SERVER: 192.168.2.1#53(192.168.2.1)

This topic was automatically closed 28 days after the last reply. New replies are no longer allowed.