mladen
May 23, 2018, 9:31pm
1
Hello,URL I managed to configure monitoring for my two logstash servers. I add first logstash server and check status in Kibana. In Pipeline Viewer I was manage to see my pipeline with pipeline.id: main. After adding my second logstash server I can see pipeline from second server but not from first logstash server. I am confused, in kibana ---> Monitor ---> Logstash I can see two nodes and one pipelines. Is it possible to see two pipelines. I have tried to change pipeline.id in logstash.yml on one server but that didn't help. I don't use multiple pipelines and don't have commercial x-pack licences.
BR,
shaunak
May 25, 2018, 9:43pm
2
Hi @mladen ,
Would it be possible for you to post here the following information (with any sensitive data redacted/blurred out)?
Which version of Logstash, Elasticsearch, and Kibana are you using?
Copies of your logstash.yml files from each of the two Logstash servers.
Your pipeline configurations.
Screenshots from the Monitoring UI showing the problem.
Thank you,
Shaunak
mladen
May 26, 2018, 1:57pm
3
Hello Shaunak,
I have server eskibanademo with following software installed:
elasticsearch version - 6.2.2
logstash version - 6.2.2
kibana version - 6.2.2
And server elasticlog with following software installed:
Because files is to big for body of this message I will just put uncomment lines from logstash.yml file ekibanademo server:
path.data: /var/lib/logstash
path.logs: /var/log/logstash
xpack.monitoring.elasticsearch.url: "http://eskibanademo:9200"
And logstash.yml from elasticlog server:
path.data: /var/lib/logstash
path.logs: /var/log/logstash
xpack.monitoring.elasticsearch.url: "http://eskibanademo:9200"
Pipeline from eskibanademo server:
input {
    beats {
        port => "5044"
    }
}

filter {
    if [cpuramiibraz] {
        csv {
            columns => [ "date_time", "cpu_utilization", "ram_utilization", "execution_group" ]
            separator => ","
        }
        mutate {convert => ["cpu_utilization", "float"] }
        mutate {convert => ["ram_utilization", "float"] }
        date {
            locale => "en"
            match => ["date_time", "dd-MM-yy;HH:mm:ss"]
            timezone => "Europe/Belgrade"
            target => "@timestamp"
        }
    }

    if [qmraz2] {
        csv {
            columns => [ "date_time", "queue_name", "curdepth", "queue_manager" ]
            separator => ","
        }
        mutate {convert => ["curdepth", "integer"] }
        date {
            locale => "en"
            match => ["date_time", "dd-MM-yy;HH:mm:ss"]
            timezone => "Europe/Belgrade"
            target => "@timestamp"
        }
    }

    if [iibraz] {
        grok {
            match => { "message" => "^%{SYSLOGTIMESTAMP:DATE_TIME} %{HOSTNAME:HOSTNAME} %{WORD:SYSTEM}\[%{BASE10NUM:PID}]: IBM Integration Bus %{WORD} \(%{WORD:NODE}.%{WORD:EG}\) \[%{WORD} %{BASE10NUM}] \(%{WORD} %{NOTSPACE}\) %{WORD:CODE}: %{GREEDYDATA:MESSAGE}$" }
        }
        date {
            locale => "en"
            match => ["DATE_TIME", "MMM dd HH:mm:ss"]
            timezone => "Europe/Belgrade"
            target => "@timestamp"
        }
    }
}

output {
    if [cpuramiibraz] {
        elasticsearch {
            hosts => [ "eskibanademo:9200" ]
            index => "iibrazcpuram-%{+YYYY.MM}"
        }

    }

    if [qmraz2] {
        elasticsearch {
            hosts => [ "eskibanademo:9200" ]
            index => "iibrazqmraz2-%{+YYYY.MM}"
        }

    }

    if [iibraz] {
        if "_grokparsefailure" in [tags] {
            # write events that didn't match to a file
            file { "path" => "/grok/kaiibraz/grok_log_filter_failures_kaiibraz.txt" }
        }

        else {
            elasticsearch {
                hosts => [ "eskibanademo:9200" ]
                index => "iibrazlog-%{+YYYY.MM}"
            }
        }
    }
}
I will put content of a pipeline file from elasticlog server to next post.
mladen
May 26, 2018, 1:58pm
4
And pipeline from elasticlog server:
input {
    file {
        path => "/log/network/asa-cluster-it-srv/*/*/asa-cluster-it-srv-*.log"
        start_position => "beginning"
        id => "asa-cluster-it-srv_syslog"
    }
}

filter {
    grok {
        # ID defined instead of generic
        id => "cisco_asa_syslog_log_parser"
        # Asa syslog code 106023
        match => { "message" => "^%{SYSLOGTIMESTAMP:date_time} %{NOTSPACE:asa} %ASA-4-%{INT:asa_syslog_code}: %{CISCO_ACTION:action}( protocol)? %{WORD:protocol} src %{DATA:src_interface}:%{DATA:src_ip}(/%{INT:src_port})? dst %{DATA:dst_interface}:%{DATA:dst_ip}(/%{INT:dst_port})? by access-group ?%{DATA:policy_id}? \[%{DATA:hashcode1}, %{DATA:hashcode2}\]$" }
        # Asa syslog code 106100
        match => { "message" => "^%{SYSLOGTIMESTAMP:date_time} %{NOTSPACE:asa} %ASA-4-%{INT:asa_syslog_code}: access-list %{NOTSPACE:policy_id} %{CISCO_ACTION:action} %{WORD:protocol} %{DATA:dst_interface}/%{IP:dst_ip}\(%{INT:dst_port}\) -> %{DATA:src_interface}/%{IP:src_ip}\(%{INT:src_port}\) hit-cnt %{INT:hit_count} %{CISCO_INTERVAL:interval} \[%{DATA:hashcode1}, %{DATA:hashcode2}\]$" }
        # Asa syslog code 313004
        match => { "message" => "^%{SYSLOGTIMESTAMP:date_time} %{NOTSPACE:asa} %ASA-4-%{INT:asa_syslog_code}: %{CISCO_ACTION:action} %{WORD:protocol} type=%{INT:icmp_type}, from %{WORD:src_interface} %{IP:src_ip} on interface %{NOTSPACE:interface}( to %{IP:dst_ip})?: %{CISCO_REASON:reason}$" }
        # Asa syslog code 313005
        match => { "message" => "^%{SYSLOGTIMESTAMP:date_time} %{NOTSPACE:asa} %ASA-4-%{INT:asa_syslog_code}: %{CISCO_REASON:reason} for %{WORD:protocol} error message: %{WORD:err_protocol} src %{DATA:err_src_interface}:%{IP:err_src_ip}(\(%{DATA:err_src_fwuser}\))? dst %{DATA:err_dst_interface}:%{IP:err_dst_ip}(\(%{DATA:err_dst_fwuser}\))? \(type %{INT:err_icmp_type}, code %{INT:err_icmp_code}\) on %{DATA:interface} interface\.  Original IP payload: %{WORD:protocol} src %{IP:orig_src_ip}(/%{INT:orig_src_port})?(\(%{DATA:orig_src_fwuser}\))? dst %{IP:orig_dst_ip}(/%{INT:orig_dst_port})?.$" }
        # Asa syslog code 313005 payload unknown
        match => { "message" => "^%{SYSLOGTIMESTAMP:date_time} %{NOTSPACE:asa} %ASA-4-%{INT:asa_syslog_code}: %{CISCO_REASON:reason} for %{WORD:protocol} error message: %{WORD:err_protocol} src %{DATA:err_src_interface}:%{IP:err_src_ip}(\(%{DATA:err_src_fwuser}\))? dst %{DATA:err_dst_interface}:%{IP:err_dst_ip}(\(%{DATA:err_dst_fwuser}\))? \(type %{INT:err_icmp_type}, code %{INT:err_icmp_code}\) on %{DATA:interface} interface\.  Original IP payload: <unknown>.$" }
        # Asa syslog code 419002
        match => { "message" => "^%{SYSLOGTIMESTAMP:date_time} %{NOTSPACE:asa} %ASA-4-%{INT:asa_syslog_code}: %{CISCO_REASON:reason} from %{DATA:src_interface}:%{IP:src_ip}/%{INT:src_port} to %{DATA:dst_interface}:%{IP:dst_ip}/%{INT:dst_port} with different initial sequence number$" }
        # Asa syslog code 500004
        match => { "message" => "^%{SYSLOGTIMESTAMP:date_time} %{NOTSPACE:asa} %ASA-4-%{INT:asa_syslog_code}: %{CISCO_REASON:reason} for protocol=%{WORD:protocol}, from %{IP:src_ip}/%{INT:src_port} to %{IP:dst_ip}/%{INT:dst_port}$" }
        # Asa syslog code 710003
        match => { "message" => "^%{SYSLOGTIMESTAMP:date_time} %{NOTSPACE:asa} %ASA-3-%{INT:asa_syslog_code}: %{WORD:protocol} (?:request|access) %{CISCO_ACTION:action} from %{IP:src_ip}/%{INT:src_port} to %{DATA:dst_interface}:%{IP:dst_ip}/%{INT:dst_port}$" }
    }

    date {
        locale => "en"
        match => ["date_time", "MMM dd HH:mm:ss"]
        timezone => "Europe/Belgrade"
        target => "@timestamp"
    }
}

output {

    if "_grokparsefailure" in [tags] {
            # write events that didn't match to a file
            file { "path" => "/log/logstash/asa_failure.log" }
        }

    else {
        elasticsearch {
            hosts => [ "eskibanademo:9200" ]
            index => "cisco-asa-%{+yyyy.MM.dd}"
        }
    }
}
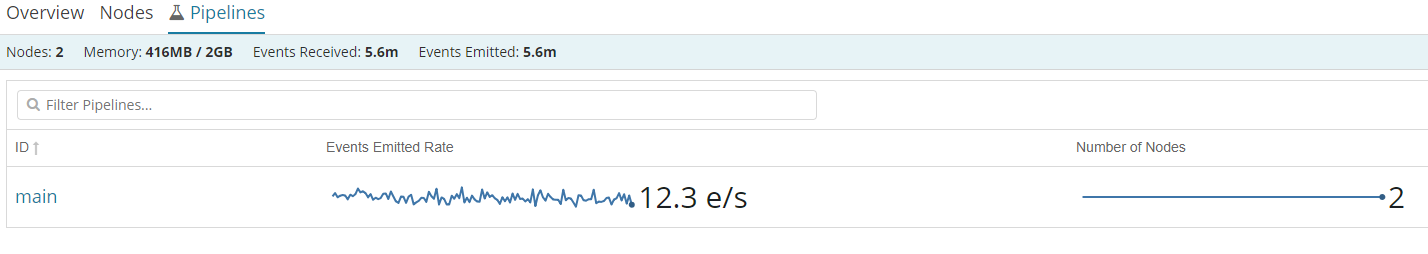
Pictures from kibana:
As you can see you it is just one main pipeline from elasitclog server:
But if I chose the first version:
I get the pipeline from eskibanademo server
If you require any further information, let me know.