We've set a new elasticsearch cluster to store netflow data. Settings are as following:
4 data nodes, each 32GB RAM (around 40% heap size), 16 cores, 240GB NFS-accessed SSD
3 master nodes 8GB RAM, 2 cores, 20GB NFS-accessed SATA
2 kibana servers (each also running a coordinating node)
All servers are running on VMware ESXi hosts and accessing remote disks on NetApp devices (via NFS). We've made sure the servers are not experiencing resources starvation from the virtualization environment.
Netflow data is being parsed by logstash netflow codec and stored to a daily index. The size of the daily index varies between 40 to 90GB (400-900M documents) and it has 64 shards.
Problem is - when we just try to retrieve the index from kibana (no filters applied, just get the index in discovery) the operation is terribly slow (>20s) and sometimes even times out (at 800M documents and above).
We've tried increasing the RAM of the data nodes to 64GB (increasing the heap size accordingly) - Each data node has around 700MB free memory within the guest OS (regardless of the heap size and RAM size), and we see in the monitoring in kibana that the load average of the data nodes is 12 (while processing the query).
We ran an experiment - setting a single data node with 64GB RAM and 32 cores and tried saving the index in this node only (60GB, 750M documents or so) - still very poor performance.
There is no doubt that the #1 bottleneck is using NFS based storage. It doesn't matter that the disks on the other end are SSDs... network and array controller latency is the killer. The problem is compounded if all servers are connecting back to the same storage array.
CPU has nothing to do with it. 8 cores should be plenty for flow use-cases.
A few other things...
You can't break the laws of physics... 900M documents is still a lot of data, even for a system that is as optimized for queries as Elasticsearch. Your choice of storage makes this even more challenging.
I can tell from the average document size (100 bytes) that you aren't doing much enrichment. The documents will grow in size as you extract more value. For example ElastiFlow does A LOT of enrichment of the raw flow data, which provides A LOT of value, but average document size is ~500 bytes. As you work to extract more value from the data, expect storage performance to become even more important.
64 shards is total overkill. 4 shards (one for each data node) and 1 replica (for redundancy) is all that is needed here.
You should use "codec": "best_compression" for your indices. You have plenty of CPU to handle the compression/decompression, and reducing the size of the data will mean less volume to read/write from storage.
Be careful with using location awareness. When it is in use, queries will prefer local shards. This usually results in the query load being concentrated on just a handful of nodes, rather than being spread evenly across the cluster.
900M is a lot? I've seen much larger clusters and even according to official elastic documentation this size of cluster should handle this data. Timeouts for queries are even more surprising...
Why would enrichment influence performance? I don't necessarily need all of the enrichment ElastiFlow does.
Agreed. But given the heap size of the data nodes should it affect performance that much? We'll try changing this but even on the single node with 16 shards the performance was as bad...
We've tried best compression, it didn't do much... We're still exploring why it didn't decrease index size significantly. We'll give it a second chance but we're expecting much bigger volumes in the future.
Indexing is very I/O intensive, so if your storage is slow I would definitely try to optimise that. If your volumes fluctuate it may make sense to use the rollover API and limit based on size and time with 4 primary shards per index.
900M is a lot? I've seen much larger clusters and even according to official elastic documentation this size of cluster should handle this data. Timeouts for queries are even more surprising...
It depends what "handle" means. Nothing is free, and at large scale, small differences can sum up to a large impact. Regarding the timeouts... that is just a Kibana setting. You can set it to a longer time period.
Why would enrichment influence performance? I don't necessarily need all of the enrichment ElastiFlow does.
Because it increases the size of the data. More data means more resources are required.
Agreed. But given the heap size of the data nodes should it affect performance that much? We'll try changing this but even on the single node with 16 shards the performance was as bad...
Shards are also broken into segments. Although segments are merged in the background as a part of normal operations, more shards will mean more segments. Segments are files. The more that are open, the more overhead there is not only for Elasticsearch but also for the OS. Each time the OS has to read from a different file, it is a context switch. Context switching is expensive. More open files also mean more page cache overhead, etc. etc. This is why it is important to force_merge indices when they are no longer written to.
We've tried best compression, it didn't do much... We're still exploring why it didn't decrease index size significantly. We'll give it a second chance but we're expecting much bigger volumes in the future.
I wouldn't expect a major improvement. Maybe 5-10%
In fact, none of these things make a major difference. However in total they can add up to a big difference.
I still stand by the opinion that NFS is probable your largest limiter.
I am also a partner in the project,
I have read your response and performed several tests depending on your responses.
first test it was check nfs - no problem was found on the nfs side. (The checked was include latency of volume and datastore. max latency was 4 ms, I am thinking it should not affect us)
In addition, I don't see I/O wait in virtual machine and don't see I/O wait in esx. Of course, as you said, it can influence maybe later but there is no bottleneck for right now...(checked with iostat,iotop,nmon)
Second test it was the settings index.
I am changed:
"number_of_shards":4
"number_of_replicas":1
"refresh_interval":"5s"
codec": "best_compression"
The results were less favorable now.
~450M documents took 25 seconds
Third test was configuring the "force merge index" to all indexes that read only to reduce the amount of segments like the number of shards.
This made a slight change to performance but not drastic.
Things we have not tried yet: the request cache or the query cache,index sort,scrolling and preindex data.
I understand that 4ms might sound low. But in fact that is about the same as a server-class spinning disk. So your NFS array has effectively turned a bunch of fast SSDs into the equivalent of a single spinning local HDD.
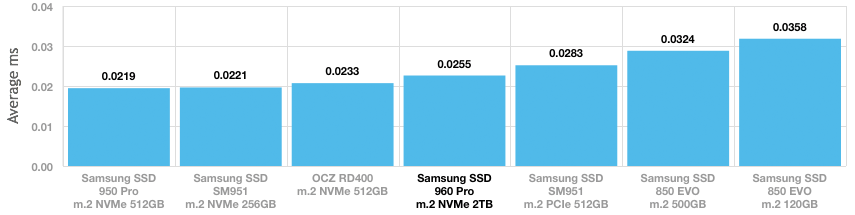
In contrast, a cheap consumer class SSD has an average latency of .034ms. That is over 100 times lower latency. Latency is critical because it is inversely proportional to IOPS capacity.
Samsung's enterprise class offerings can drop this down to less than 16 microseconds.
Our lab box is a single server with only 4 cores and 32GB RAM, and it gets about the same performance you get for your whole cluster. The difference... it has two local SSDs.
I have read your response and I understood the problem.
It's a bit hard for us to change NFS to local SSD,
if you have some solution to optimize performance via NFS
or something else to minimize the problem as much as possible.
At a minimum, the NFS traffic and VM traffic should be on separate NICs. Ideally NFS traffic would not share any links with any other traffic end-to-end. One of the benefits of giving NFS its own physical network is that it can be kept flat, eliminating any layer-3 devices between ESXi server and storage array. You should also configure the QoS policies of the network to give the highest priority to NFS traffic. If all of your network gear end-to-end supports CEE (converged enhanced ethernet) features, use them. I wouldn't expect any of these changes to make a significant difference, but would be better than nothing.
You could also increase the amount of RAM (without increasing the JVM heap size) providing more RAM for the page cache, which will allow for more data to be accessed from RAM rather than disk.
Thanks for the answers, I've been on vacation until recently and could not check your recommendations.
Today I tried to play with shard request cache.
I have increased: indicites.requests.cache.size: 15%
I did not see any change. However, when I ran the Kibana query manually using dev tools with “_search? Request_cache = true”, the results were amazing after the first time.
Is it possible to force Kibana to use this setting whenever I query Elasticsearch (e.g. in Discover, Dashboard, Timelion etc.)? From what I’ve seen it’s impossible to make Kibana use this setting…
Apache, Apache Lucene, Apache Hadoop, Hadoop, HDFS and the yellow elephant
logo are trademarks of the
Apache Software Foundation
in the United States and/or other countries.