Hello ,
I have an index which is giving me some trouble. The index gets somewhere around 40 GB of data per hour.
I have a 3 node setup. With 32 GB of RAM on each node and 12 cores for processing.
I have allocated 20GB JB of java heap on each node.
Using elasticsearch 7.1
the problem is that the dashboards which I have created on this index do not load if I choose a time interval greater than 1 hour.
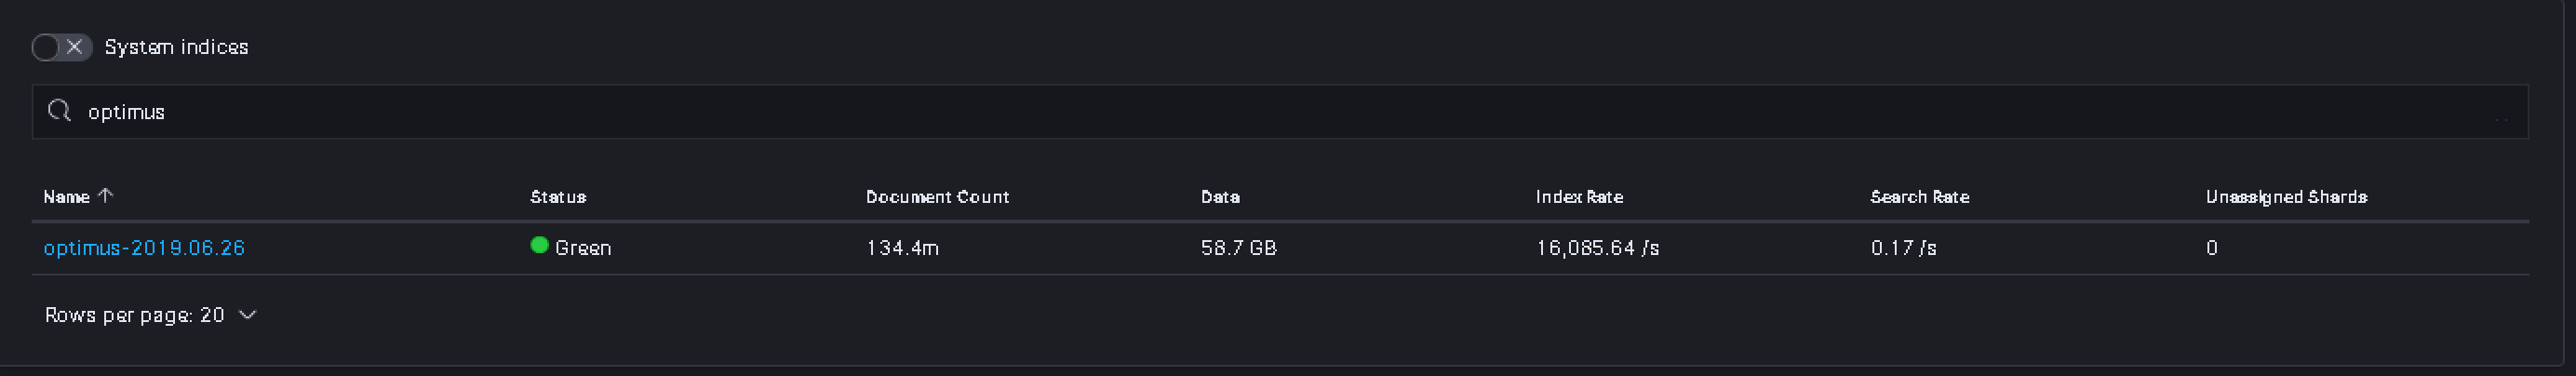
few more details ab out my index ( optimus- )
it currently has 9 shards and 2 replicas and gets created every day

What type of storage do you have? What does CPU usage look like while indexing?
We have SSD's in use , unfortunately I am not collecting system metrics over time. So I do not have any CPU stats. But indexing is happening all the time so I think I can get you some stats from the system now .
you want CPU stats from all 3 nodes ?
previously things were dead slow , back then my shard had of 5 primary shards and 1 replica shard.
I have increase this to 9 primary and two replicas , I have got slight performance improvement.
Hey christian can you please suggest how many shards and replicas should I keep for such an index.
Or I would need to do horizontal scaling.?
I have attached few more monitoring snapshots in my first comment.
Please suggest something
40GB per hour is almost 1TB per day, which sounds like a lot for a 3 node cluster. I would recommend monitoring CPU usage and disk I/O, including iowait, to see if you can identify what is limiting performance when you are querying and indexing at the same time. It may be worthwhile looking at network traffic as well as this also potentially can be a bottleneck during heavy indexing.
What does your dashboards look like? How many visualizations? Any performance intensive aggregation types or filters being used?