I had xpack.monitoring.enabled: false
but i turned this of as well. giving it a run now; though im not optimistic, initial heap usage patterns seem to mimic the earlier runaway trends.
I had xpack.monitoring.enabled: false
but i turned this of as well. giving it a run now; though im not optimistic, initial heap usage patterns seem to mimic the earlier runaway trends.
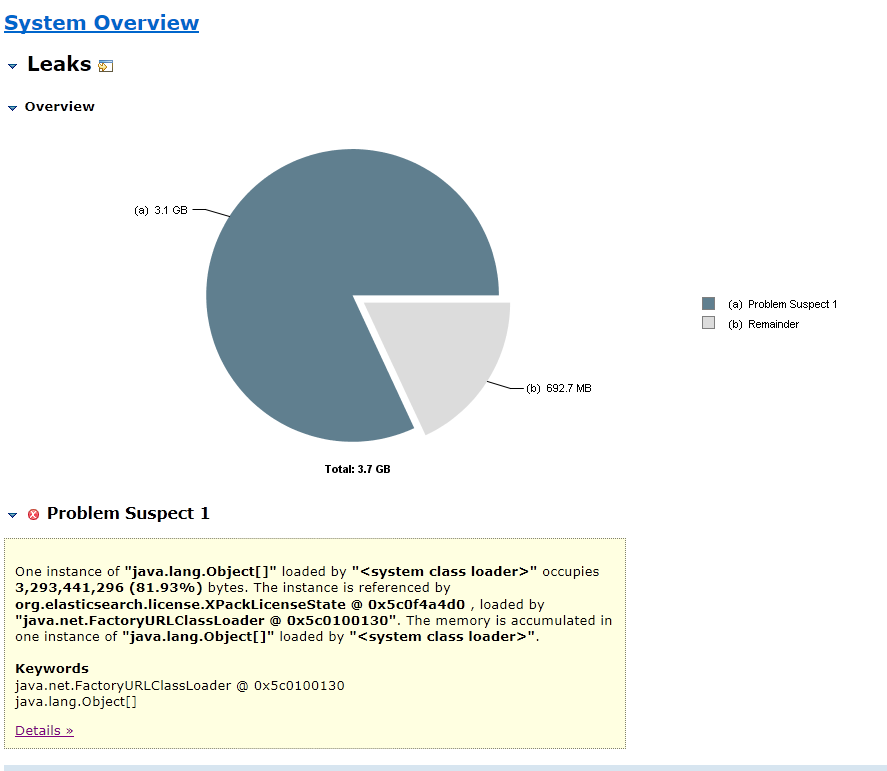
@DavidTurner i cracked one of the heap dumps open, and ran the leak analyzer suspect.
i am still trying to figure where to start looking. I will look into uploading the dumps into a public location so you can pull them.
Follow up question, before I upload anything, do the heapdumps contain any personal/private data?
also, i had just updated to 6.5 No improvement. Seems to me whatever is going on is very cluster/os specific.
A heap dump can be assumed to contain everything in memory in the Elasticsearch process, so if Elasticsearch has access to personal/private data then yes.
I think I've found something, but I think it only explains this situation if you're creating a lot of new indices (and possibly deleting them again) or if the shards in your cluster are moving around a lot. Does that sound like your cluster?
@DavidTurner I think it depends on the scale?
i have nightly curator jobs that compacts/snapshots/deletes indices daily, and then a lot of new daily indices are created.
I would say, daily turnover is, say, 15 indices per day. So, every night when the time rolls over, curator snapshots to s3, and deletes 15 indices, and 15 new indices are created.
This worked without any issues on 6.2.3 (as per my original report), and only started running away, on master node only (non-master master-eligible node is fine), after upgrade to 6.4.2. since then ive updated to 6.4.3 and now to 6.5.0 asap.
the stack is primarily for monitoring with elk + beats + grafana and a few open source scripts. My one thought was that you guys are caching credentials somehow, because i had https://github.com/trevorndodds/elasticsearch-metrics/blob/master/Grafana/elasticsearch2elastic.py this thing running and maybe because of frequency of re-authing it was causing that object space to run away, but i turned that off the other day, as well as cerebro manager as well, but the issue persists.
i have disabled all 3rd party tools for monitoring the cluster, besides grafana as i would imagine its not the cause, but again, i am no expert here so maybe its worth checking as well, and enabled native monitoring that comes with basic license and set collection interval to 30s.
edit: about 70% of all log flow goes through logstash, but we have some kubernetes logs from filebeat/metricbeat that go directly to ES. again, not sure of the relevance here.
edit 2: to elabote on my thought process a little more, it seems between 6.2.3 and 6.4.x due to the basic license opening, the cluster stats moved under that space. we have some containerized clusters using 6.2.3 right now which are being monitored by that same python script which are running fine, but in that version cluster stats were not behind the wall. i had tried to disable basic license entirely during the test, but did nto finish it as it killed all access to metrics via web requests.
also, given what you mentioned (and i looked up in the interim), im afraid i cannot expose the dump publicly.
Ok 15 indices per day is not a lot at all.
I ask about this because if I understand your screenshot correctly the heap dump has 358,000+ instances of things like IndexSettings and IndexMetaData, which are created (once) when the first shard of an index is allocated to a node. They should be cleaned up when the last shard of that index is deallocated, but even if they weren't I can't see how Elasticsearch would ever perform hundreds of thousands of shard allocations like this.
EDIT this is wrong and I corrected it here
Okay, let me get a more updated dump. These dumps are a few weeks old, and I have since updated ES, updated java, and other stuff.
I will follow up.
I forgot to link the issue I opened: https://github.com/elastic/elasticsearch/issues/35628
This would explain a little difference in behaviour between 6.2 (without X-pack) and 6.4, which could be amplified by the creation of hundreds of thousands of indices, but at 15 new indices per day it doesn't explain what we're seeing here.
Meanwhile, is there a particular view/report you would find more helpful? I apologize, this was my very first time cracking a heap dump open, so I am still learning what most of the stuff even means. If you could give me a little guidance as to what to look for, what reports, sorts, or tables to generate, i would be much obliged.
Another thing to note, the OOM takes about, 4 hours to achieve. This can happen during the day without any indices created or deleted in the interim.
I'm sorry, what I said here is wrong. We also create new instances of these things when the index settings or metadata are updated. Perhaps this is happening a lot?
If you grab some fresher heap dumps and they show the same pattern then I would look into some of those instances further: IndexMetaData.index.name is the String name of the index in question - perhaps this'll tell us something?
Okay, I will get one when it gets close to the death point. Should be a few hours.
Meanwhile, are there any queries I can run that would expose some of the metadata updates?
I am tailing the log flow for both nodes, but i do not see anything really happening, aside from an occasional date parsing error (i doubt its at all relevant).
would metricbeat or filebeat agent that has
setup.template.enabled: true
trigger this? even if the net delta is zero?
Could you try setting logger.org.elasticsearch.indices.IndicesService: DEBUG? You can enable this dynamically:
PUT /_cluster/settings
{
  "persistent": {
    "logger.org.elasticsearch.indices.IndicesService": "DEBUG"
  }
}
I think this logs something every time we create an org.elasticsearch.xpack.security.authz.accesscontrol.OptOutQueryCache, of which your heap dump contains too many, so this may be illuminating.
You can disable this again by setting it to null:
PUT /_cluster/settings
{
  "persistent": {
    "logger.org.elasticsearch.indices.IndicesService": null
  }
}
Apologies for prolonged absence, priorities shifted a little bit. I still plan on getting that info for you.
Thanks @hollowimage. Just so you know, #36308 should fix the leak that we suspected to contribute to your issue, and this has been merged so should be released in 6.5.3 (the next patch release).
6.5.3 is now released, so the best next step is probably to upgrade and see if it helps.
I will as soon as it makes it over into the yum repo. Thanks @DavidTurner Ill let you know if that resolves the issue.
© 2020. All Rights Reserved - Elasticsearch
Apache, Apache Lucene, Apache Hadoop, Hadoop, HDFS and the yellow elephant logo are trademarks of the Apache Software Foundation in the United States and/or other countries.