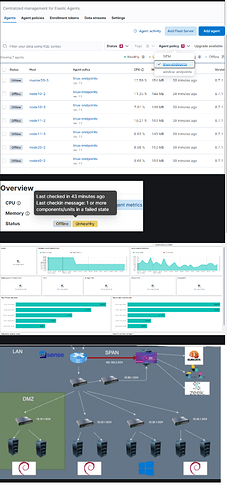
I checked the health of a specific pod in Kubernetes by accessing it, and the fleet appears to be healthy, but the logs are not being sent to the agents and they appear as offline. However, when I check the Elasticsearch dashboard, it shows that everything is working properly. What could be causing this issue
root@master20-3:/home/server/kube# kubectl get all
NAME                 TYPE        CLUSTER-IP   EXTERNAL-IP   PORT(S)   AGE
service/kubernetes   ClusterIP   10.233.0.1   <none>        443/TCP   3h43m
root@master20-3:/home/server/kube# kubectl -n kube-system get pods -o wide | grep elastic
elastic-agent-4kqd8                        1/1     Running   0               42m     10.10.1.2        node10-2     <none>           <none>
elastic-agent-dmllr                        1/1     Running   0               42m     10.40.1.2        node40-2     <none>           <none>
elastic-agent-jcl2g                        1/1     Running   0               42m     10.20.1.2        node20-2     <none>           <none>
elastic-agent-kghhq                        1/1     Running   0               42m     10.20.1.3        master20-3   <none>           <none>
elastic-agent-tpklq                        1/1     Running   0               42m     10.11.1.2        node11-2     <none>           <none>
elastic-agent-vdh6j                        1/1     Running   0               42m     10.11.1.3        node11-3     <none>           <none>
elastic-agent-zl55x                        1/1     Running   0               42m     10.10.1.3        node10-3     <none>           <none>
I have manually checked the health of specific pods and they appear to be functioning properly, which makes it even more confusing as to why the agent status is showing as offline.
kubectl -n kube-system exec -it elastic-agent-4kqd8 -- curl -f https://10.60.1.2:8220/api/status --insecure
{"name":"fleet-server","status":"HEALTHY"}
The network is configured as follows, and the SIEM at 10.60.1.2 is used as the FLEET to send agent cluster logs there.
Also, the SIEM monitors traffic from other LANs using SPAN.

