Problèmes lors d'indexation de fichiers CSV

Bonjour,

J'utilise ELK (pour la première fois) pour traiter des fichiers CSV. Cependant, j'ai un problème lorsque je lance logstash avec mon fichier de configuration que voici :

input {
	file { 
		path => "/home/user/network_capt/csv/*.csv"
		start_position => "beginning"
		sincedb_path => "/dev/null"
	}
}

filter {
	csv {
		columns => [ "frame.number","frame.time_epoch","frame.time","frame.len","ip.src","ip.dst","ip.proto","tcp.srcport","tcp.dstport","udp.srcport","udp.dstport","_ws.col.Protocol","_ws.col.Info","tcp.window_size","tcp.flags","tcp.flags.syn","tcp.flags.ack","tcp.flags.fin","tcp.flags.push","tcp.flags.reset","tcp.flags.urg","tcp.analysis.retransmission","icmp.type","icmp.code","dns.qry.name","dns.qry.type"]
		separator => ";"
		skip_empty_columns => "true"
		skip_empty_rows => "true"
		
	}
	mutate {
		add_field => { "hostname" => "%{ip.src}"}
	}
	date {
		match => ["timestamp", "UNIX", "UNIX_MS"]
		locale => "en"
	}
	geoip {
		source => "ip.src" 
		target => "ip.src"
	}
	geoip {
		source => "ip.dst" 
		target => "ip.dst" 
	}
}

output { 
	elasticsearch {
		hosts => "localhost:9200"
		index => "honeypot-%{+YYYYMMdd}"
	}
stdout{}
}

Voici ce que j'obtiens :

Could not find log4j2 configuration at path /usr/share/logstash/config/log4j2.properties. Using default config which logs errors to the console
[WARN ] 2019-05-24 16:03:55.748 [LogStash::Runner] multilocal - Ignoring the 'pipelines.yml' file because modules or command line options are specified
[INFO ] 2019-05-24 16:03:55.765 [LogStash::Runner] runner - Starting Logstash {"logstash.version"=>"7.1.0"}
[INFO ] 2019-05-24 16:04:04.562 [[main]-pipeline-manager] elasticsearch - Elasticsearch pool URLs updated {:changes=>{:removed=>[], :added=>[http://localhost:9200/]}}
[WARN ] 2019-05-24 16:04:04.806 [[main]-pipeline-manager] elasticsearch - Restored connection to ES instance {:url=>"http://localhost:9200/"}
[INFO ] 2019-05-24 16:04:05.054 [[main]-pipeline-manager] elasticsearch - ES Output version determined {:es_version=>7}
[WARN ] 2019-05-24 16:04:05.058 [[main]-pipeline-manager] elasticsearch - Detected a 6.x and above cluster: the `type` event field won't be used to determine the document _type {:es_version=>7}
[INFO ] 2019-05-24 16:04:05.103 [[main]-pipeline-manager] elasticsearch - New Elasticsearch output {:class=>"LogStash::Outputs::ElasticSearch", :hosts=>["//localhost:9200"]}
[INFO ] 2019-05-24 16:04:05.128 [Ruby-0-Thread-5: :1] elasticsearch - Using default mapping template
[INFO ] 2019-05-24 16:04:05.135 [[main]-pipeline-manager] geoip - Using geoip database {:path=>"/usr/share/logstash/vendor/bundle/jruby/2.5.0/gems/logstash-filter-geoip-6.0.1-java/vendor/GeoLite2-City.mmdb"}
[INFO ] 2019-05-24 16:04:05.183 [[main]-pipeline-manager] geoip - Using geoip database {:path=>"/usr/share/logstash/vendor/bundle/jruby/2.5.0/gems/logstash-filter-geoip-6.0.1-java/vendor/GeoLite2-City.mmdb"}
[INFO ] 2019-05-24 16:04:05.242 [[main]-pipeline-manager] javapipeline - Starting pipeline {:pipeline_id=>"main", "pipeline.workers"=>2, "pipeline.batch.size"=>125, "pipeline.batch.delay"=>50, "pipeline.max_inflight"=>250, :thread=>"#<Thread:0x6d4ac5e1 run>"}
[INFO ] 2019-05-24 16:04:05.342 [Ruby-0-Thread-5: :1] elasticsearch - Attempting to install template {:manage_template=>{"index_patterns"=>"logstash-*", "version"=>60001, "settings"=>{"index.refresh_interval"=>"5s", "number_of_shards"=>1}, "mappings"=>{"dynamic_templates"=>[{"message_field"=>{"path_match"=>"message", "match_mapping_type"=>"string", "mapping"=>{"type"=>"text", "norms"=>false}}}, {"string_fields"=>{"match"=>"*", "match_mapping_type"=>"string", "mapping"=>{"type"=>"text", "norms"=>false, "fields"=>{"keyword"=>{"type"=>"keyword", "ignore_above"=>256}}}}}], "properties"=>{"@timestamp"=>{"type"=>"date"}, "@version"=>{"type"=>"keyword"}, "geoip"=>{"dynamic"=>true, "properties"=>{"ip"=>{"type"=>"ip"}, "location"=>{"type"=>"geo_point"}, "latitude"=>{"type"=>"half_float"}, "longitude"=>{"type"=>"half_float"}}}}}}}
[INFO ] 2019-05-24 16:04:05.827 [[main]-pipeline-manager] javapipeline - Pipeline started {"pipeline.id"=>"main"}
[INFO ] 2019-05-24 16:04:06.023 [Ruby-0-Thread-1: /usr/share/logstash/lib/bootstrap/environment.rb:6] agent - Pipelines running {:count=>1, :running_pipelines=>[:main], :non_running_pipelines=>[]}
[INFO ] 2019-05-24 16:04:06.051 [[main]<file] observingtail - START, creating Discoverer, Watch with file and sincedb collections
[INFO ] 2019-05-24 16:04:06.932 [Api Webserver] agent - Successfully started Logstash API endpoint {:port=>9600}
[WARN ] 2019-05-24 16:04:09.679 [[main]>worker0] elasticsearch - Could not index event to Elasticsearch. {:status=>400, :action=>["index", {:_id=>nil, :_index=>"honeypot-20190524", :_type=>"_doc", :routing=>nil}, #<LogStash::Event:0x76e5053a>], :response=>{"index"=>{"_index"=>"honeypot-20190524", "_type"=>"_doc", "_id"=>"0Csn6moB1EZoSNMt-Ht2", "status"=>400, "error"=>{"type"=>"illegal_argument_exception", "reason"=>"Can't merge a non object mapping [tcp.flags] with an object mapping [tcp.flags]"}}}}
[WARN ] 2019-05-24 16:04:09.684 [[main]>worker0] elasticsearch - Could not index event to Elasticsearch. {:status=>400, :action=>["index", {:_id=>nil, :_index=>"honeypot-20190524", :_type=>"_doc", :routing=>nil}, #<LogStash::Event:0x17e6b7af>], :response=>{"index"=>{"_index"=>"honeypot-20190524", "_type"=>"_doc", "_id"=>"0Ssn6moB1EZoSNMt-Ht2", "status"=>400, "error"=>{"type"=>"illegal_argument_exception", "reason"=>"Can't merge a non object mapping [tcp.flags] with an object mapping [tcp.flags]"}}}}

Puis à la suite de ces warnings, voici ce que j'obtiens :


Mon index est bien créé, seulement j'ai l'impression qu'il est vide. De plus, le champ "mapping" est également vide ce qui m'intrigue :

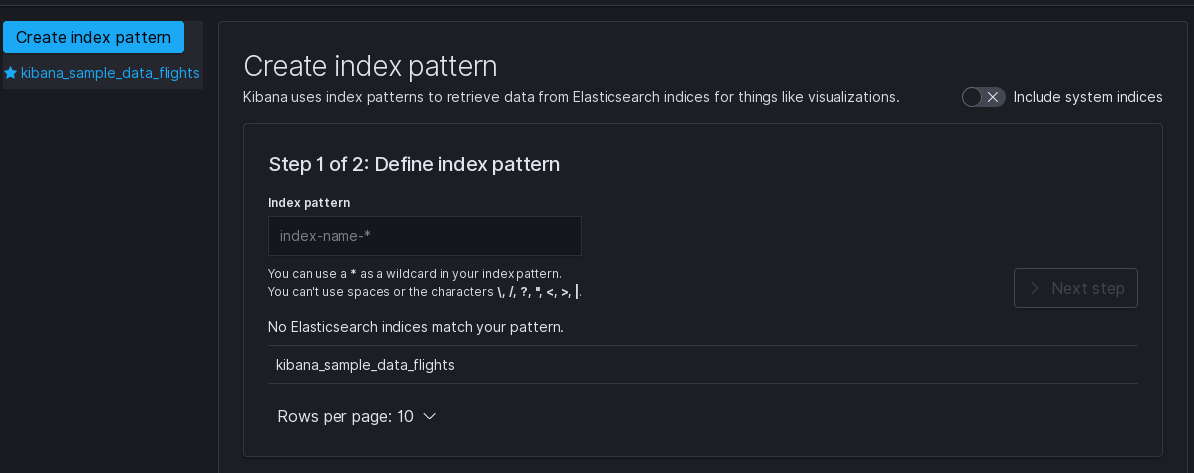
De plus, lorsque je veux créer un index-pattern, je ne vois pas l'index qui a été créé :

J'aimerais avoir un visuel sur les données de mes CSV, mais je suis actuellement bloqué par le problème que j'ai présenté ci-dessus. Je suis débutant avec ELK, je ne l'utilise que depuis aujourd'hui, n'hésitez pas à me donner vos conseils.

Excusez-moi pour la qualité de ce topic mais je manque de temps et j'ai besoin de trouver une solution assez rapidement...

Merci d'avance à tous/toutes pour votre aide.

Tu as une erreur dans les logs:

Can't merge a non object mapping [tcp.flags] with an object mapping [tcp.flags]

Cela veut dire que ton mapping ne correspond pas à ce que tu veux faire.
Insérer une valeur dans tcp.flags alors que ton mapping dit que c'est un objet.

Regarde ce que donne:

GET /honeypot-20190524/_mapping
1 Like

Bonjour David.
Merci pour ta réponse.

Voici ce que me donne :

GET /honeypot-20190524/_mapping
{
  "honeypot-20190524" : {
    "mappings" : { }
  }
}

Comme je l'ai dit précédemment, il n'y a rien dans le champ mapping et c'est ce que je trouve bizarre. D'après ce que j'ai vu sur le forum, je suis sensé obtenir mes fields avec le type de données qu'ils contiennent si je ne me trompe pas.
Dois-je le faire à la main ?

Merci beaucoup.

Il y a des templates?

Apparrement oui, voici ce qu'un :

GET /_template

me donne :

{
  ".ml-meta" : {
    "order" : 0,
    "version" : 7010099,
    "index_patterns" : [
      ".ml-meta"
    ],
    "settings" : {
      "index" : {
        "number_of_shards" : "1",
        "auto_expand_replicas" : "0-1",
        "unassigned" : {
          "node_left" : {
            "delayed_timeout" : "1m"
          }
        }
      }
    },
    "mappings" : {
      "_meta" : {
        "version" : "7.1.0"
      },
      "dynamic_templates" : [
        {
          "strings_as_keywords" : {
            "match" : "*",
            "mapping" : {
              "type" : "keyword"
            }
          }
        }
      ],

Je devrais me baser sur celui-ci pour en créer un ?

Non. Il n'y a qu'un seul template ? Quel est le nom des autres ?

1 Like

Je ne sais pas si c'est la bonne commande, mais voici ce que j'obtiens :

Évite les captures d'écran quand c'est du code STP. Peu lisible (sur mobile), non cherchable...

Peux-tu donner le détail du template logstash STP?

1 Like

Désolé pour la capture d'écran.

Voici ce que me donne

GET /_template/logstash

  "logstash" : {
    "order" : 0,
    "version" : 60001,
    "index_patterns" : [
      "logstash-*"
    ],
    "settings" : {
      "index" : {
        "number_of_shards" : "1",
        "refresh_interval" : "5s"
      }
    },
    "mappings" : {
      "dynamic_templates" : [
        {
          "message_field" : {
            "path_match" : "message",
            "mapping" : {
              "norms" : false,
              "type" : "text"
            },
            "match_mapping_type" : "string"
          }
        },
        {
          "string_fields" : {
            "mapping" : {
              "norms" : false,
              "type" : "text",
              "fields" : {
                "keyword" : {
                  "ignore_above" : 256,
                  "type" : "keyword"
                }
              }
            },
            "match_mapping_type" : "string",
            "match" : "*"
          }
        }
      ],
      "properties" : {
        "@timestamp" : {
          "type" : "date"
        },
        "geoip" : {
          "dynamic" : true,
          "properties" : {
            "ip" : {
              "type" : "ip"
            },
            "latitude" : {
              "type" : "half_float"
            },
            "location" : {
              "type" : "geo_point"
            },
            "longitude" : {
              "type" : "half_float"
            }
          }
        },
        "@version" : {
          "type" : "keyword"
        }
      }
    },
    "aliases" : { }
  }
}

Ok.

Peux tu mettre le codec json dans le plugin stdout, récupérer le json généré et faire:

PUT /honeypot-20190524/_doc/1
{ le json }
1 Like

Bonjour David.

J'ai ajouté

codec => json

en stdout, et voici une partie de ce que cela m'a donné :

{"ip.proto":"6","message":"31;1558459581.304011000;May 21, 2019 19:26:21.304011000 CEST;66;10.1.2.1;10.1.2.15;6;59696;21;;;TCP;59696 → 21 [ACK] Seq=65 Ack=285 Win=229 Len=0 TSval=54924 TSecr=10966;229;0x00000010;0;1;0;0;0;0;;;;;","tcp.srcport":"59696","tcp.flags.fin":"0","_ws.col.Protocol":"TCP","_ws.col.Info":"59696 → 21 [ACK] Seq=65 Ack=285 Win=229 Len=0 TSval=54924 TSecr=10966","@version":"1","frame.number":"31","tags":["_geoip_lookup_failure"],"ip.dst":"10.1.2.15","path":"/home/user/network_capt/csv/arm_05-21-19_19:19:29.csv","tcp.flags.syn":"0","tcp.window_size":"229","ip.src":"10.1.2.1","frame.time":"May 21, 2019 19:26:21.304011000 CEST","tcp.dstport":"21","tcp.flags.push":"0","tcp.flags":"0x00000010","tcp.flags.urg":"0","hostname":"10.1.2.1","frame.len":"66","tcp.flags.reset":"0","frame.time_epoch":"1558459581.304011000","tcp.flags.ack":"1","@timestamp":"2019-05-26T11:37:34.655Z","host":"Honeypot"}

Ensuite je suis allé dans la console dev de Kibana, et j'ai fais un

 PUT /honeypot-20190514/_doc/1
{ le json ci-dessus}

Et voici ce que ça me donne :

{
  "error": {
    "root_cause": [
      {
        "type": "mapper_parsing_exception",
        "reason": "object mapping for [tcp.flags] tried to parse field [tcp.flags] as object, but found a concrete value"
      }
    ],
    "type": "mapper_parsing_exception",
    "reason": "object mapping for [tcp.flags] tried to parse field [tcp.flags] as object, but found a concrete value"
  },
  "status": 400
}

La même erreur que dans les logs visiblement.

Ok. J'ai compris.

Tu as un champ tcp.flag et des champs tcp.flag.xyz. Ça n'est pas possible.
Je te propose de renommer tcp.flag en tcp.flag.flag.

1 Like

Merci beaucoup David !

Effectivement, c'était bien ça. J'ai renommé mon champs tcp.flag en tcp.flag.flag et je n'ai plus les erreurs.

Je peux maintenant créer un index pattern qui match avec mon index, il y a un mapping de mon index et je vois mes données.

Si je veux modifier le mapping (par exemple mettre le type ip pour mes champs ip.src et ip.dst ), je dois prendre le mapping de mon index, remplacer les types et refaire un PUT du mapping modifié et l'indiquer comme template dans mon fichier de conf logstash ?

Comme cela ? :

      "ip": {
        "properties": {
          "dst": {
            "type": "ip",
            "fields": {
              "keyword": {
                "type": "ip",
                "ignore_above": 256
              }
            }
          },

et indiquer dans ma conf :

template_name => "nom_du_template"

Encore merci pour ton aide !

Oui. Par contre le sous champ keyword ne sert à rien. Supprime le.

1 Like

C'est noté.

Merci beaucoup pour ton aide !

This topic was automatically closed 28 days after the last reply. New replies are no longer allowed.