Hello everyone,
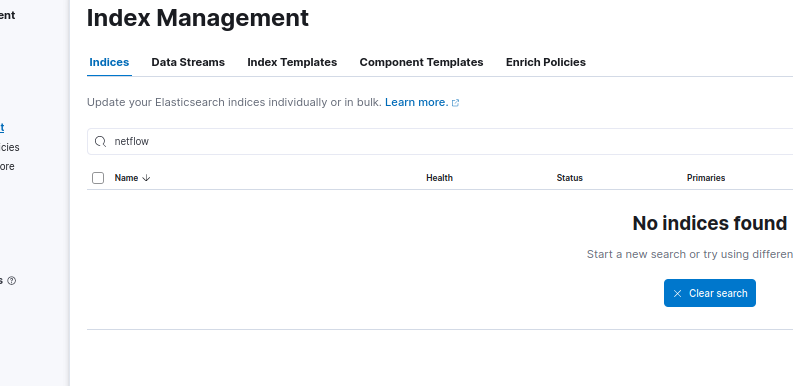
It seems there are issues with indexing events into Elasticsearch
● logstash.service - logstash
     Loaded: loaded (/lib/systemd/system/logstash.service; enabled; vendor preset: enabled)
     Active: active (running) since Wed 2024-05-08 17:11:17 +01; 48s ago
   Main PID: 7714 (java)
      Tasks: 81 (limit: 9386)
     Memory: 791.6M
        CPU: 2min 6.558s
     CGroup: /system.slice/logstash.service
             └─7714 /usr/share/logstash/jdk/bin/java -Xms1g -Xmx1g -Djava.awt.headless=true -Dfile.encoding=UTF-8 -Djruby.compile.invokedynamic=true -XX:+HeapDumpOnOutOfMemoryError -Djava.security.egd=file:/dev/urandom -Dlog4j2.isThreadContextMapInheritable=true -Dlogstash.jackson.stream-read-constraints.max-string-length=200000000 -Dlogstash.jackson.stream-read-constraints.max-number-length=10000 -Djruby.regexp.interruptible=true -Djdk.io.File.enableADS=true --add-exports=jdk.compiler/com.sun.tools.javac.api=ALL-UNNAMED --add-exports=jdk.compiler/com.sun.tools.javac.file=ALL-UNNAMED --add-exports=jdk.compiler/com.sun.tools.javac.parser=ALL-UNNAMED --add-exports=jdk.compiler/com.sun.tools.javac.tree=ALL-UNNAMED --add-exports=jdk.compiler/com.sun.tools.javac.util=ALL-UNNAMED --add-opens=java.bas>

ماي 08 17:11:52 adnane-virtual-machine logstash[7714]: [2024-05-08T17:11:52,083][WARN ][logstash.outputs.elasticsearch][main][45d9e59ef8366f15f02073ad413193ea18fe5176dfda287b2cbd39e702745f2a] Could not index event to Elasticsearch. {:status=>400, :action=>["index", {:_id=>nil, :_index=>"netflow-2024.05.08", :routing=>nil}, {"netflow"=>{"options"=>{"application_id"=>[13, 0, 0, 61], "application_description"=>"Real Time Protocol", "application_name"=>"rtp"}, "exporter"=>{"version"=>9, "uptime_millis"=>8279456, "address"=>"10.1.1.1:56303", "source_id"=>0, "timestamp"=>"2024-05-08T16:07:06.000Z"}, "scope"=>{"octet_delta_count"=>167837953}, "type"=>"netflow_options"}, "event"=>{"dataset"=>"netflow.log", "action"=>"netflow_options", "category"=>["network"], "created"=>"2024-05-08T16:11:30.630Z", "mod>
ماي 08 17:11:52 adnane-virtual-machine logstash[7714]: [2024-05-08T17:11:52,083][WARN ][logstash.outputs.elasticsearch][main][45d9e59ef8366f15f02073ad413193ea18fe5176dfda287b2cbd39e702745f2a] Could not index event to Elasticsearch. {:status=>400, :action=>["index", {:_id=>nil, :_index=>"netflow-2024.05.08", :routing=>nil}, {"netflow"=>{"type"=>"netflow_options", "exporter"=>{"uptime_millis"=>8279460, "address"=>"10.1.1.1:56303", "version"=>9, "timestamp"=>"2024-05-08T16:07:06.000Z", "source_id"=>0}, "scope"=>{"octet_delta_count"=>167837953}, "options"=>{"application_id"=>[3, 0, 0, 179], "application_description"=>"Border Gateway Protocol", "application_name"=>"bgp"}}, "event"=>{"dataset"=>"netflow.log", "action"=>"netflow_options", "category"=>["network"], "kind"=>"event", "module"=>"netflow", >
ماي 08 17:11:52 adnane-virtual-machine logstash[7714]: [2024-05-08T17:11:52,078][WARN ][logstash.outputs.elasticsearch][main][45d9e59ef8366f15f02073ad413193ea18fe5176dfda287b2cbd39e702745f2a] Could not index event to Elasticsearch. {:status=>400, :action=>["index", {:_id=>nil, :_index=>"netflow-2024.05.08", :routing=>nil}, {"netflow"=>{"type"=>"netflow_options", "exporter"=>{"version"=>9, "uptime_millis"=>8279456, "address"=>"10.1.1.1:56303", "timestamp"=>"2024-05-08T16:07:06.000Z", "source_id"=>0}, "scope"=>{"octet_delta_count"=>167837953}, "options"=>{"application_id"=>[13, 0, 0, 83], "application_description"=>"Skype Peer-to-Peer Internet Telephony Protocol", "application_name"=>"skype"}}, "event"=>{"dataset"=>"netflow.log", "action"=>"netflow_options", "category"=>["network"], "created"=>"2>
ماي 08 17:11:52 adnane-virtual-machine logstash[7714]: [2024-05-08T17:11:52,084][WARN ][logstash.outputs.elasticsearch][main][45d9e59ef8366f15f02073ad413193ea18fe5176dfda287b2cbd39e702745f2a] Could not index event to Elasticsearch. {:status=>400, :action=>["index", {:_id=>nil, :_index=>"netflow-2024.05.08", :routing=>nil}, {"netflow"=>{"type"=>"netflow_options", "exporter"=>{"version"=>9, "uptime_millis"=>8279460, "address"=>"10.1.1.1:56303", "source_id"=>0, "timestamp"=>"2024-05-08T16:07:06.000Z"}, "scope"=>{"octet_delta_count"=>167837953}, "options"=>{"application_id"=>[1, 0, 0, 47], "application_description"=>"General Routing Encapsulation", "application_name"=>"gre"}}, "event"=>{"dataset"=>"netflow.log", "action"=>"netflow_options", "category"=>["network"], "created"=>"2024-05-08T16:11:30.6>
ماي 08 17:11:52 adnane-virtual-machine logstash[7714]: [2024-05-08T17:11:52,086][WARN ][logstash.outputs.elasticsearch][main][45d9e59ef8366f15f02073ad413193ea18fe5176dfda287b2cbd39e702745f2a] Could not index event to Elasticsearch. {:status=>400, :action=>["index", {:_id=>nil, :_index=>"netflow-2024.05.08", :routing=>nil}, {"netflow"=>{"options"=>{"application_id"=>[13, 0, 1, 169], "application_description"=>"VDOLive streaming video", "application_name"=>"vdolive"}, "exporter"=>{"uptime_millis"=>8279460, "address"=>"10.1.1.1:56303", "version"=>9, "source_id"=>0, "timestamp"=>"2024-05-08T16:07:06.000Z"}, "scope"=>{"octet_delta_count"=>167837953}, "type"=>"netflow_options"}, "event"=>{"dataset"=>"netflow.log", "action"=>"netflow_options", "category"=>["network"], "created"=>"2024-05-08T16:11:30.6>
ماي 08 17:11:52 adnane-virtual-machine logstash[7714]: [2024-05-08T17:11:52,083][WARN ][logstash.outputs.elasticsearch][main][45d9e59ef8366f15f02073ad413193ea18fe5176dfda287b2cbd39e702745f2a] Could not index event to Elasticsearch. {:status=>400, :action=>["index", {:_id=>nil, :_index=>"netflow-2024.05.08", :routing=>nil}, {"netflow"=>{"type"=>"netflow_options", "exporter"=>{"uptime_millis"=>8280462, "address"=>"10.1.1.1:56303", "version"=>9, "source_id"=>0, "timestamp"=>"2024-05-08T16:07:07.000Z"}, "scope"=>{"octet_delta_count"=>167837953}, "options"=>{"application_id"=>[3, 0, 0, 79], "application_description"=>"Finger", "application_name"=>"finger"}}, "event"=>{"dataset"=>"netflow.log", "action"=>"netflow_options", "category"=>["network"], "created"=>"2024-05-08T16:11:31.641Z", "kind"=>"event>
ماي 08 17:11:52 adnane-virtual-machine logstash[7714]: [2024-05-08T17:11:52,087][WARN ][logstash.outputs.elasticsearch][main][45d9e59ef8366f15f02073ad413193ea18fe5176dfda287b2cbd39e702745f2a] Could not index event to Elasticsearch. {:status=>400, :action=>["index", {:_id=>nil, :_index=>"netflow-2024.05.08", :routing=>nil}, {"netflow"=>{"type"=>"netflow_options", "exporter"=>{"address"=>"10.1.1.1:56303", "version"=>9, "uptime_millis"=>8279460, "source_id"=>0, "timestamp"=>"2024-05-08T16:07:06.000Z"}, "scope"=>{"octet_delta_count"=>167837953}, "options"=>{"application_id"=>[13, 0, 0, 113], "application_description"=>"telepresence-media stream", "application_name"=>"telepresence-media"}}, "event"=>{"dataset"=>"netflow.log", "action"=>"netflow_options", "category"=>["network"], "created"=>"2024-05->
ماي 08 17:11:52 adnane-virtual-machine logstash[7714]: [2024-05-08T17:11:52,089][WARN ][logstash.outputs.elasticsearch][main][45d9e59ef8366f15f02073ad413193ea18fe5176dfda287b2cbd39e702745f2a] Could not index event to Elasticsearch. {:status=>400, :action=>["index", {:_id=>nil, :_index=>"netflow-2024.05.08", :routing=>nil}, {"netflow"=>{"type"=>"netflow_options", "exporter"=>{"address"=>"10.1.1.1:56303", "version"=>9, "uptime_millis"=>8279460, "source_id"=>0, "timestamp"=>"2024-05-08T16:07:06.000Z"}, "scope"=>{"octet_delta_count"=>167837953}, "options"=>{"application_id"=>[1, 0, 0, 89], "application_description"=>"Open Shortest Path First", "application_name"=>"ospf"}}, "event"=>{"dataset"=>"netflow.log", "action"=>"netflow_options", "category"=>["network"], "created"=>"2024-05-08T16:11:30.636Z">
ماي 08 17:11:52 adnane-virtual-machine logstash[7714]: [2024-05-08T17:11:52,089][WARN ][logstash.outputs.elasticsearch][main][45d9e59ef8366f15f02073ad413193ea18fe5176dfda287b2cbd39e702745f2a] Could not index event to Elasticsearch. {:status=>400, :action=>["index", {:_id=>nil, :_index=>"netflow-2024.05.08", :routing=>nil}, {"netflow"=>{"type"=>"netflow_options", "exporter"=>{"version"=>9, "uptime_millis"=>8280462, "address"=>"10.1.1.1:56303", "source_id"=>0, "timestamp"=>"2024-05-08T16:07:07.000Z"}, "scope"=>{"octet_delta_count"=>167837953}, "options"=>{"application_id"=>[13, 0, 0, 12], "application_description"=>"CU-SeeMe desktop video conference", "application_name"=>"cuseeme"}}, "event"=>{"dataset"=>"netflow.log", "action"=>"netflow_options", "category"=>["network"], "kind"=>"event", "module>
ماي 08 17:11:52 adnane-virtual-machine logstash[7714]: [2024-05-08T17:11:52,090][WARN ][logstash.outputs.elasticsearch][main][45d9e59ef8366f15f02073ad413193ea18fe5176dfda287b2cbd39e702745f2a] Could not index event to Elasticsearch. {:status=>400, :action=>["index", {:_id=>nil, :_index=>"netflow-2024.05.08", :routing=>nil}, {"netflow"=>{"options"=>{"application_id"=>[3, 0, 0, 70], "application_description"=>"Internet Gopher protocol, online document management.", "application_name"=>"gopher"}, "exporter"=>{"address"=>"10.1.1.1:56303", "version"=>9, "uptime_millis"=>8280462, "source_id"=>0, "timestamp"=>"2024-05-08T16:07:07.000Z"}, "scope"=>{"octet_delta_count"=>167837953}, "type"=>"netflow_options"}, "event"=>{"dataset"=>"netflow.log", "action"=>"netflow_options", "category"=>["network"], "kind">
# Module: netflow
# Docs: https://www.elastic.co/guide/en/beats/filebeat/8.12/filebeat-module-netflow.html

- module: netflow
  log:
    enabled: true
    var:
      netflow_host: 0.0.0.0
      netflow_port: 2055
      # internal_networks specifies which networks are considered internal or private
      # you can specify either a CIDR block or any of the special named ranges listed
      # at: https://www.elastic.co/guide/en/beats/filebeat/current/defining-processors.html#condition-network
/etc/filebeat/modules.d/netflow.yml
input {
  beats {
    port => 5044
    type => "netflow"
  }
}

output {
    if [type] == "netflow" {
        elasticsearch {
            hosts => ["0.0.0.0:9200"]
            index => "netflow-%{+YYYY.MM.dd}"
        }
    }
}
/etc/filebeat/filebeat.yml
###################### Filebeat Configuration Example #########################

# This file is an example configuration file highlighting only the most common
# options. The filebeat.reference.yml file from the same directory contains all the
# supported options with more comments. You can use it as a reference.
#
# You can find the full configuration reference here:
# https://www.elastic.co/guide/en/beats/filebeat/index.html

# For more available modules and options, please see the filebeat.reference.yml sample
# configuration file.

# ============================== Filebeat inputs ===============================

filebeat.inputs:

# Each - is an input. Most options can be set at the input level, so
# you can use different inputs for various configurations.
# Below are the input-specific configurations.

# filestream is an input for collecting log messages from files.
- type: filestream
  # Unique ID among all inputs, an ID is required.
  id: my-filestream-id

  # Change to true to enable this input configuration.
  enabled: false

  # Paths that should be crawled and fetched. Glob based paths.
  paths:
    - /var/log/*.log
    #- c:\programdata\elasticsearch\lo

  # Exclude lines. A list of regular expressions to match. It drops the lines that are
  # matching any regular expression from the list.
  # Line filtering happens after the parsers pipeline. If you would like to filter lines
  # before parsers, use include_message parser.
  #exclude_lines: ['^DBG']

  # Include lines. A list of regular expressions to match. It exports the lines that are
  # matching any regular expression from the list.
  # Line filtering happens after the parsers pipeline. If you would like to filter lines
  # before parsers, use include_message parser.
  #include_lines: ['^ERR', '^WARN']

  # Exclude files. A list of regular expressions to match. Filebeat drops the files that
  # are matching any regular expression from the list. By default, no files are dropped.
  #prospector.scanner.exclude_files: ['.gz$']

  # Optional additional fields. These fields can be freely picked
  # to add additional information to the crawled log files for filtering
  #fields:
  #  level: debug
  #  review: 1

# ============================== Filebeat modules ==============================

filebeat.config.modules:
  # Glob pattern for configuration loading
  path: ${path.config}/modules.d/*.yml

  # Set to true to enable config reloading
  reload.enabled: true

  # Period on which files under path should be checked for changes
  #reload.period: 10s

# ======================= Elasticsearch template setting =======================
setup.template.settings:
  index.number_of_shards: 1
  #index.codec: best_compression
  #_source.enabled: false


# ================================== General ===================================

# The name of the shipper that publishes the network data. It can be used to group
# all the transactions sent by a single shipper in the web interface.
#name:

# The tags of the shipper are included in their field with each
# transaction published.
#tags: ["service-X", "web-tier"]

# Optional fields that you can specify to add additional information to the
# output.
#fields:
#  env: staging


# =================================== Kibana ===================================

# Starting with Beats version 6.0.0, the dashboards are loaded via the Kibana API.
# This requires a Kibana endpoint configuration.
setup.kibana:

  # Kibana Host
  # Scheme and port can be left out and will be set to the default (http and 5601)
  # In case you specify and additional path, the scheme is required: http://localhost:5601/path
  # IPv6 addresses should always be defined as: https://[2001:db8::1]:5601
  host: "0.0.0.0:5601"

  # Kibana Space ID
  # ID of the Kibana Space into which the dashboards should be loaded. By default,
  # the Default Space will be used.
  #space.id:


# ================================== Outputs ===================================

# Configure what output to use when sending the data collected by the beat.

# ---------------------------- Elasticsearch Output ----------------------------
#output.elasticsearch:
  # Array of hosts to connect to.
  #hosts: ["0.0.0.0:9200"]
  # Performance preset - one of "balanced", "throughput", "scale",
  # "latency", or "custom".
  preset: balanced

  # Protocol - either `http` (default) or `https`.
  #protocol: "https"

  # Authentication credentials - either API key or username/password.
  #api_key: "id:api_key"
  #username: "elastic"
  #password: "changeme"

output.logstash:
  # The Logstash hosts
  hosts: ["0.0.0.0:5044"]


# ================================= Processors =================================
processors:
  - add_host_metadata:
      when.not.contains.tags: forwarded
  - add_cloud_metadata: ~
  - add_docker_metadata: ~
  - add_kubernetes_metadata: ~