Random network spike until cluster restarted. Is that a bug?

We're running an Elasticsearch cluster. The cluster behaves normally for few days but then the network transfer start to spike for all nodes, then this causes other issues like cpu spike and high GC, high latency, etc.. The cluster won't stabilize until it's restarted.

Please check this graph screenshot to see how the network sent/received were spiking until we restarted the cluster.

As we're 100% sure that this is not related to an overload, we wonder if this might be a bug with Elasticsearch.

We're running ES 7.11.0 on ECK.

Why are you running such an old version? I would recommend uyou upgrade to at least 7.17.

What is the full output of the cluster stats API?

Is there anything in the Elasticsearch logs around the time network traffic increases?

Thanks @Christian_Dahlqvist I agree that we should upgrade the version, I just want to make sure that it was the issue before risking any breaking change upgrade.

I didn't find any abnormal logs around the incident time. Logs look calm.

Here is the current full output of cluster stats. Please note that some indices version mismatch with ES version. Is that a serious concern?

{
  "_nodes" : {
    "total" : 10,
    "successful" : 10,
    "failed" : 0
  },
  "cluster_name" : "es",
  "cluster_uuid" : "ro-B1E7ZRcWafSbSXik7Ew",
  "timestamp" : 1671448737840,
  "status" : "green",
  "indices" : {
    "count" : 10,
    "shards" : {
      "total" : 35,
      "primaries" : 14,
      "replication" : 1.5,
      "index" : {
        "shards" : {
          "min" : 2,
          "max" : 10,
          "avg" : 3.5
        },
        "primaries" : {
          "min" : 1,
          "max" : 5,
          "avg" : 1.4
        },
        "replication" : {
          "min" : 1.0,
          "max" : 6.0,
          "avg" : 1.7
        }
      }
    },
    "docs" : {
      "count" : 1180236,
      "deleted" : 42664
    },
    "store" : {
      "size" : "6.7gb",
      "size_in_bytes" : 7222943931,
      "reserved" : "0b",
      "reserved_in_bytes" : 0
    },
    "fielddata" : {
      "memory_size" : "72.5mb",
      "memory_size_in_bytes" : 76115420,
      "evictions" : 0
    },
    "query_cache" : {
      "memory_size" : "533.9mb",
      "memory_size_in_bytes" : 559858176,
      "total_count" : 126451334,
      "hit_count" : 6489755,
      "miss_count" : 119961579,
      "cache_size" : 12805,
      "cache_count" : 32958,
      "evictions" : 20153
    },
    "completion" : {
      "size" : "0b",
      "size_in_bytes" : 0
    },
    "segments" : {
      "count" : 305,
      "memory" : "4.3mb",
      "memory_in_bytes" : 4536060,
      "terms_memory" : "1.8mb",
      "terms_memory_in_bytes" : 1955696,
      "stored_fields_memory" : "149.8kb",
      "stored_fields_memory_in_bytes" : 153416,
      "term_vectors_memory" : "0b",
      "term_vectors_memory_in_bytes" : 0,
      "norms_memory" : "154.8kb",
      "norms_memory_in_bytes" : 158528,
      "points_memory" : "0b",
      "points_memory_in_bytes" : 0,
      "doc_values_memory" : "2.1mb",
      "doc_values_memory_in_bytes" : 2268420,
      "index_writer_memory" : "73.9mb",
      "index_writer_memory_in_bytes" : 77515210,
      "version_map_memory" : "340.6kb",
      "version_map_memory_in_bytes" : 348794,
      "fixed_bit_set" : "5.3kb",
      "fixed_bit_set_memory_in_bytes" : 5440,
      "max_unsafe_auto_id_timestamp" : 1671213609095,
      "file_sizes" : { }
    },
    "mappings" : {
      "field_types" : [
        {
          "name" : "boolean",
          "count" : 13,
          "index_count" : 4
        },
        {
          "name" : "date",
          "count" : 19,
          "index_count" : 5
        },
        {
          "name" : "float",
          "count" : 105,
          "index_count" : 1
        },
        {
          "name" : "keyword",
          "count" : 64,
          "index_count" : 5
        },
        {
          "name" : "long",
          "count" : 11,
          "index_count" : 4
        },
        {
          "name" : "nested",
          "count" : 1,
          "index_count" : 1
        },
        {
          "name" : "object",
          "count" : 10,
          "index_count" : 4
        },
        {
          "name" : "text",
          "count" : 36,
          "index_count" : 5
        }
      ]
    },
    "analysis" : {
      "char_filter_types" : [ ],
      "tokenizer_types" : [ ],
      "filter_types" : [ ],
      "analyzer_types" : [ ],
      "built_in_char_filters" : [ ],
      "built_in_tokenizers" : [ ],
      "built_in_filters" : [ ],
      "built_in_analyzers" : [ ]
    },
    "versions" : [
      {
        "version" : "7.4.2",
        "index_count" : 1,
        "primary_shard_count" : 5,
        "total_primary_size" : "1.3kb",
        "total_primary_bytes" : 1417
      },
      {
        "version" : "7.9.1",
        "index_count" : 1,
        "primary_shard_count" : 1,
        "total_primary_size" : "948.1mb",
        "total_primary_bytes" : 994185328
      },
      {
        "version" : "7.10.2",
        "index_count" : 1,
        "primary_shard_count" : 1,
        "total_primary_size" : "4.6mb",
        "total_primary_bytes" : 4838068
      },
      {
        "version" : "7.11.0",
        "index_count" : 7,
        "primary_shard_count" : 7,
        "total_primary_size" : "6.1mb",
        "total_primary_bytes" : 6404375
      }
    ]
  },
  "nodes" : {
    "count" : {
      "total" : 10,
      "coordinating_only" : 0,
      "data" : 7,
      "data_cold" : 0,
      "data_content" : 0,
      "data_hot" : 0,
      "data_warm" : 0,
      "ingest" : 7,
      "master" : 3,
      "ml" : 0,
      "remote_cluster_client" : 7,
      "transform" : 0,
      "voting_only" : 0
    },
    "versions" : [
      "7.11.0"
    ],
    "os" : {
      "available_processors" : 24,
      "allocated_processors" : 24,
      "names" : [
        {
          "name" : "Linux",
          "count" : 10
        }
      ],
      "pretty_names" : [
        {
          "pretty_name" : "CentOS Linux 8",
          "count" : 10
        }
      ],
      "mem" : {
        "total" : "100gb",
        "total_in_bytes" : 107431350272,
        "free" : "18.6gb",
        "free_in_bytes" : 20023144448,
        "used" : "81.4gb",
        "used_in_bytes" : 87408205824,
        "free_percent" : 19,
        "used_percent" : 81
      }
    },
    "process" : {
      "cpu" : {
        "percent" : 15
      },
      "open_file_descriptors" : {
        "min" : 520,
        "max" : 582,
        "avg" : 559
      }
    },
    "jvm" : {
      "max_uptime" : "13d",
      "max_uptime_in_millis" : 1125190301,
      "versions" : [
        {
          "version" : "15.0.1",
          "vm_name" : "OpenJDK 64-Bit Server VM",
          "vm_version" : "15.0.1+9",
          "vm_vendor" : "AdoptOpenJDK",
          "bundled_jdk" : true,
          "using_bundled_jdk" : true,
          "count" : 10
        }
      ],
      "mem" : {
        "heap_used" : "18.9gb",
        "heap_used_in_bytes" : 20353723392,
        "heap_max" : "67.1gb",
        "heap_max_in_bytes" : 72074919936
      },
      "threads" : 479
    },
    "fs" : {
      "total" : "185.5gb",
      "total_in_bytes" : 199282421760,
      "free" : "178.7gb",
      "free_in_bytes" : 191884034048,
      "available" : "178.5gb",
      "available_in_bytes" : 191716261888
    },
    "plugins" : [
      {
        "name" : "repository-s3",
        "version" : "7.11.0",
        "elasticsearch_version" : "7.11.0",
        "java_version" : "1.8",
        "description" : "The S3 repository plugin adds S3 repositories",
        "classname" : "org.elasticsearch.repositories.s3.S3RepositoryPlugin",
        "extended_plugins" : [ ],
        "has_native_controller" : false,
        "licensed" : false,
        "type" : "isolated"
      },
      {
        "name" : "repository-gcs",
        "version" : "7.11.0",
        "elasticsearch_version" : "7.11.0",
        "java_version" : "1.8",
        "description" : "The GCS repository plugin adds Google Cloud Storage support for repositories.",
        "classname" : "org.elasticsearch.repositories.gcs.GoogleCloudStoragePlugin",
        "extended_plugins" : [ ],
        "has_native_controller" : false,
        "licensed" : false,
        "type" : "isolated"
      }
    ],
    "network_types" : {
      "transport_types" : {
        "security4" : 10
      },
      "http_types" : {
        "security4" : 10
      }
    },
    "discovery_types" : {
      "zen" : 10
    },
    "packaging_types" : [
      {
        "flavor" : "default",
        "type" : "docker",
        "count" : 10
      }
    ],
    "ingest" : {
      "number_of_pipelines" : 2,
      "processor_stats" : {
        "gsub" : {
          "count" : 0,
          "failed" : 0,
          "current" : 0,
          "time" : "0s",
          "time_in_millis" : 0
        },
        "script" : {
          "count" : 0,
          "failed" : 0,
          "current" : 0,
          "time" : "0s",
          "time_in_millis" : 0
        }
      }
    }
  }
}

I see you have snapshot repository plugins installed. Could it be that you are creating a snapshot at that time?

It does not have to be obnormal. I am looking for anything starting or happening around that time. It could be long GC causing shard relocation or network issues.

We take snapshots at hourly basis, it takes few seconds to complete, sometimes a bit more. The index size is around 1G.

Here the logs from all nodes around network spike incident


2022-12-16T17:19:28.85976671Z stdout F {"type": "server", "timestamp": "2022-12-16T17:19:28,859Z", "level": "INFO", "component": "o.e.m.j.JvmGcMonitorService", "cluster.name": "es", "node.name": "es-data-azb-spot-v1-2", "message": "[gc][262464] overhead, spent [278ms] collecting in the last [1s]", "cluster.uuid": "ro-B1E7ZRcWafSbSXik7Ew", "node.id": "vf1m25zjS3yK7edG4pmANQ"  }

2022-12-16T17:19:28.344216433Z stdout F {"type": "index_search_slowlog", "timestamp": "2022-12-16T17:19:28,343Z", "level": "INFO", "component": "i.s.s.query", "cluster.name": "es", "node.name": "es-data-azb-spot-v1-2", "message": "[search.index.v4][0]", "took": "1s", "took_millis": "1001", "total_hits": "0+ hits", "types": "[]", "stats": "[]", "search_type": "QUERY_THEN_FETCH", "total_shards": "1", "source": "{\"from\":396025,\"size\":35,\"timeout\":\"10s\",\"query\":{\"match_all\":{\"boost\":1.0}},\"sort\":[{\"publishedAt\":{\"order\":\"desc\"}}],\"track_total_hits\":-1}", "cluster.uuid": "ro-B1E7ZRcWafSbSXik7Ew", "node.id": "vf1m25zjS3yK7edG4pmANQ"  }

2022-12-16T17:19:25.18829492Z stdout F {"type": "index_search_slowlog", "timestamp": "2022-12-16T17:19:25,188Z", "level": "INFO", "component": "i.s.s.query", "cluster.name": "es", "node.name": "es-data-azb-ondemand-v1-0", "message": "[search.index.v4][0]", "took": "1.1s", "took_millis": "1106", "total_hits": "0+ hits", "types": "[]", "stats": "[]", "search_type": "QUERY_THEN_FETCH", "total_shards": "1", "source": "{\"from\":402115,\"size\":35,\"timeout\":\"10s\",\"query\":{\"match_all\":{\"boost\":1.0}},\"sort\":[{\"publishedAt\":{\"order\":\"desc\"}}],\"track_total_hits\":-1}", "cluster.uuid": "ro-B1E7ZRcWafSbSXik7Ew", "node.id": "jHR-y1SaTB6_EE9mDBMTHQ"  }

2022-12-16T17:19:24.398582927Z stdout F {"type": "index_search_slowlog", "timestamp": "2022-12-16T17:19:24,398Z", "level": "INFO", "component": "i.s.s.query", "cluster.name": "es", "node.name": "es-data-azb-spot-v1-2", "message": "[search.index.v4][0]", "took": "1s", "took_millis": "1046", "total_hits": "0+ hits", "types": "[]", "stats": "[]", "search_type": "QUERY_THEN_FETCH", "total_shards": "1", "source": "{\"from\":405860,\"size\":35,\"timeout\":\"10s\",\"query\":{\"match_all\":{\"boost\":1.0}},\"sort\":[{\"publishedAt\":{\"order\":\"desc\"}}],\"track_total_hits\":-1}", "cluster.uuid": "ro-B1E7ZRcWafSbSXik7Ew", "node.id": "vf1m25zjS3yK7edG4pmANQ"  }

2022-12-16T17:19:24.23656946Z stdout F {"type": "server", "timestamp": "2022-12-16T17:19:24,236Z", "level": "INFO", "component": "o.e.m.j.JvmGcMonitorService", "cluster.name": "es", "node.name": "es-data-azb-ondemand-v1-0", "message": "[gc][880123] overhead, spent [320ms] collecting in the last [1s]", "cluster.uuid": "ro-B1E7ZRcWafSbSXik7Ew", "node.id": "jHR-y1SaTB6_EE9mDBMTHQ"  }

2022-12-16T17:19:23.858555884Z stdout F {"type": "server", "timestamp": "2022-12-16T17:19:23,858Z", "level": "INFO", "component": "o.e.m.j.JvmGcMonitorService", "cluster.name": "es", "node.name": "es-data-azb-spot-v1-2", "message": "[gc][262459] overhead, spent [294ms] collecting in the last [1s]", "cluster.uuid": "ro-B1E7ZRcWafSbSXik7Ew", "node.id": "vf1m25zjS3yK7edG4pmANQ"  }

2022-12-16T17:16:23.842077266Z stdout F {"type": "index_search_slowlog", "timestamp": "2022-12-16T17:16:23,841Z", "level": "INFO", "component": "i.s.s.query", "cluster.name": "es", "node.name": "es-data-azb-spot-v1-0", "message": "[search.index.v4][0]", "took": "1s", "took_millis": "1029", "total_hits": "0+ hits", "types": "[]", "stats": "[]", "search_type": "QUERY_THEN_FETCH", "total_shards": "1", "source": "{\"from\":382375,\"size\":35,\"timeout\":\"10s\",\"query\":{\"match_all\":{\"boost\":1.0}},\"sort\":[{\"publishedAt\":{\"order\":\"desc\"}}],\"track_total_hits\":-1}", "cluster.uuid": "ro-B1E7ZRcWafSbSXik7Ew", "node.id": "lFc-GfxPTUW6W6G8srGipw"  }

2022-12-16T17:16:23.167357766Z stdout F {"type": "server", "timestamp": "2022-12-16T17:16:23,167Z", "level": "INFO", "component": "o.e.m.j.JvmGcMonitorService", "cluster.name": "es", "node.name": "es-data-azb-spot-v1-2", "message": "[gc][262279] overhead, spent [252ms] collecting in the last [1s]", "cluster.uuid": "ro-B1E7ZRcWafSbSXik7Ew", "node.id": "vf1m25zjS3yK7edG4pmANQ"  }

2022-12-16T17:16:21.149265959Z stdout F {"type": "server", "timestamp": "2022-12-16T17:16:21,149Z", "level": "INFO", "component": "o.e.m.j.JvmGcMonitorService", "cluster.name": "es", "node.name": "es-data-azb-spot-v1-0", "message": "[gc][784665] overhead, spent [371ms] collecting in the last [1s]", "cluster.uuid": "ro-B1E7ZRcWafSbSXik7Ew", "node.id": "lFc-GfxPTUW6W6G8srGipw"  }

2022-12-16T17:16:20.179422575Z stdout F {"type": "index_search_slowlog", "timestamp": "2022-12-16T17:16:20,179Z", "level": "INFO", "component": "i.s.s.query", "cluster.name": "es", "node.name": "es-data-azb-spot-v1-1", "message": "[search.index.v4][0]", "took": "1s", "took_millis": "1083", "total_hits": "0+ hits", "types": "[]", "stats": "[]", "search_type": "QUERY_THEN_FETCH", "total_shards": "1", "source": "{\"from\":389970,\"size\":35,\"timeout\":\"10s\",\"query\":{\"match_all\":{\"boost\":1.0}},\"sort\":[{\"publishedAt\":{\"order\":\"desc\"}}],\"track_total_hits\":-1}", "cluster.uuid": "ro-B1E7ZRcWafSbSXik7Ew", "node.id": "N7YJUmUpSPKBj5p15WGokw"  }

2022-12-16T17:16:19.908592789Z stdout F {"type": "index_search_slowlog", "timestamp": "2022-12-16T17:16:19,908Z", "level": "INFO", "component": "i.s.s.query", "cluster.name": "es", "node.name": "es-data-azb-spot-v1-2", "message": "[search.index.v4][0]", "took": "1s", "took_millis": "1063", "total_hits": "0+ hits", "types": "[]", "stats": "[]", "search_type": "QUERY_THEN_FETCH", "total_shards": "1", "source": "{\"from\":383740,\"size\":35,\"timeout\":\"10s\",\"query\":{\"match_all\":{\"boost\":1.0}},\"sort\":[{\"publishedAt\":{\"order\":\"desc\"}}],\"track_total_hits\":-1}", "cluster.uuid": "ro-B1E7ZRcWafSbSXik7Ew", "node.id": "vf1m25zjS3yK7edG4pmANQ"  }

2022-12-16T17:16:18.537198311Z stdout F {"type": "index_search_slowlog", "timestamp": "2022-12-16T17:16:18,536Z", "level": "INFO", "component": "i.s.s.query", "cluster.name": "es", "node.name": "es-data-azb-spot-v1-1", "message": "[search.index.v4][0]", "took": "1s", "took_millis": "1098", "total_hits": "0+ hits", "types": "[]", "stats": "[]", "search_type": "QUERY_THEN_FETCH", "total_shards": "1", "source": "{\"from\":378175,\"size\":35,\"timeout\":\"10s\",\"query\":{\"match_all\":{\"boost\":1.0}},\"sort\":[{\"publishedAt\":{\"order\":\"desc\"}}],\"track_total_hits\":-1}", "cluster.uuid": "ro-B1E7ZRcWafSbSXik7Ew", "node.id": "N7YJUmUpSPKBj5p15WGokw"  }

2022-12-16T17:16:18.059858155Z stdout F {"type": "server", "timestamp": "2022-12-16T17:16:18,059Z", "level": "INFO", "component": "o.e.m.j.JvmGcMonitorService", "cluster.name": "es", "node.name": "es-data-azb-spot-v1-0", "message": "[gc][784662] overhead, spent [387ms] collecting in the last [1s]", "cluster.uuid": "ro-B1E7ZRcWafSbSXik7Ew", "node.id": "lFc-GfxPTUW6W6G8srGipw"  }

2022-12-16T17:13:37.949263719Z stdout F {"type": "index_search_slowlog", "timestamp": "2022-12-16T17:13:37,949Z", "level": "INFO", "component": "i.s.s.query", "cluster.name": "es", "node.name": "es-data-azb-spot-v1-1", "message": "[search.index.v4][0]", "took": "1s", "took_millis": "1023", "total_hits": "0+ hits", "types": "[]", "stats": "[]", "search_type": "QUERY_THEN_FETCH", "total_shards": "1", "source": "{\"from\":358295,\"size\":35,\"timeout\":\"10s\",\"query\":{\"match_all\":{\"boost\":1.0}},\"sort\":[{\"publishedAt\":{\"order\":\"desc\"}}],\"track_total_hits\":-1}", "cluster.uuid": "ro-B1E7ZRcWafSbSXik7Ew", "node.id": "N7YJUmUpSPKBj5p15WGokw"  }

2022-12-16T17:13:37.475298023Z stdout F {"type": "server", "timestamp": "2022-12-16T17:13:37,474Z", "level": "INFO", "component": "o.e.m.j.JvmGcMonitorService", "cluster.name": "es", "node.name": "es-data-azb-spot-v1-2", "message": "[gc][262114] overhead, spent [251ms] collecting in the last [1s]", "cluster.uuid": "ro-B1E7ZRcWafSbSXik7Ew", "node.id": "vf1m25zjS3yK7edG4pmANQ"  }

2022-12-16T17:10:37.06971855Z stdout F {"type": "server", "timestamp": "2022-12-16T17:10:37,069Z", "level": "INFO", "component": "o.e.m.j.JvmGcMonitorService", "cluster.name": "es", "node.name": "es-data-azb-ondemand-v1-2", "message": "[gc][879829] overhead, spent [259ms] collecting in the last [1s]", "cluster.uuid": "ro-B1E7ZRcWafSbSXik7Ew", "node.id": "kv_7iljPS_uWogNdpcA9QA"  }

2022-12-16T17:08:14.470691907Z stdout F {"type": "server", "timestamp": "2022-12-16T17:08:14,470Z", "level": "INFO", "component": "o.e.m.j.JvmGcMonitorService", "cluster.name": "es", "node.name": "es-data-azb-spot-v1-2", "message": "[gc][261792] overhead, spent [263ms] collecting in the last [1s]", "cluster.uuid": "ro-B1E7ZRcWafSbSXik7Ew", "node.id": "vf1m25zjS3yK7edG4pmANQ"  }

this is again a network chart per node at that same time range

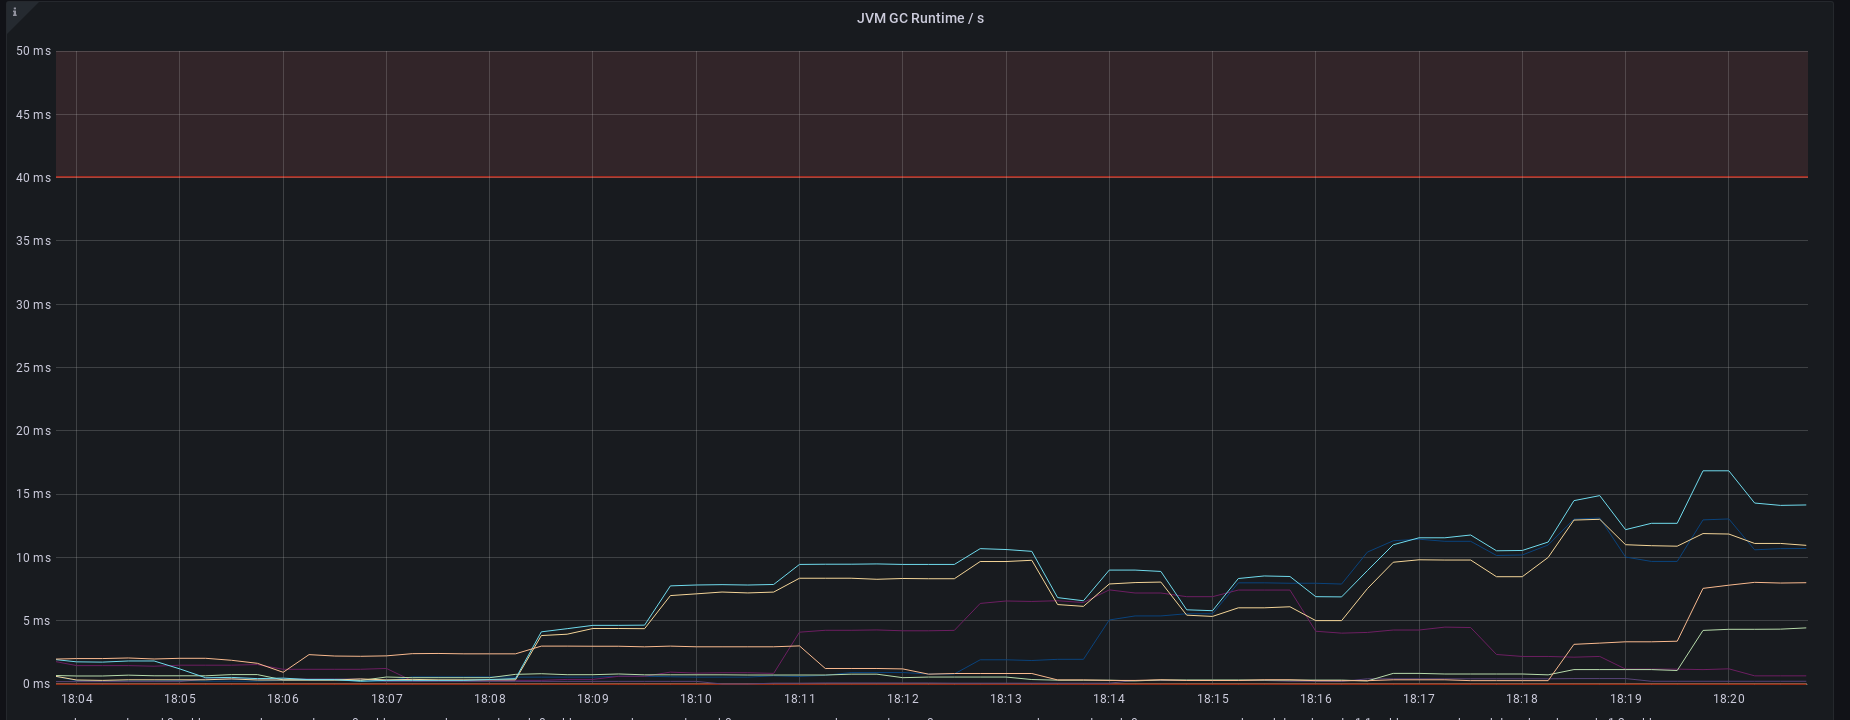
This is GC runtime /s graph at the time time range, it's way too high than our baseline, but still not critical (less than 40ms)

This is our GC runtime/s now

Can you grab the output from hot threads during the time this happens?

This topic was automatically closed 28 days after the last reply. New replies are no longer allowed.