Range buckets for distributing documents over the average of one of their fields

Hello,
I did not find the answer in the previous Kibana discussions so I thought I would explain what I am trying and not managing to achieve :

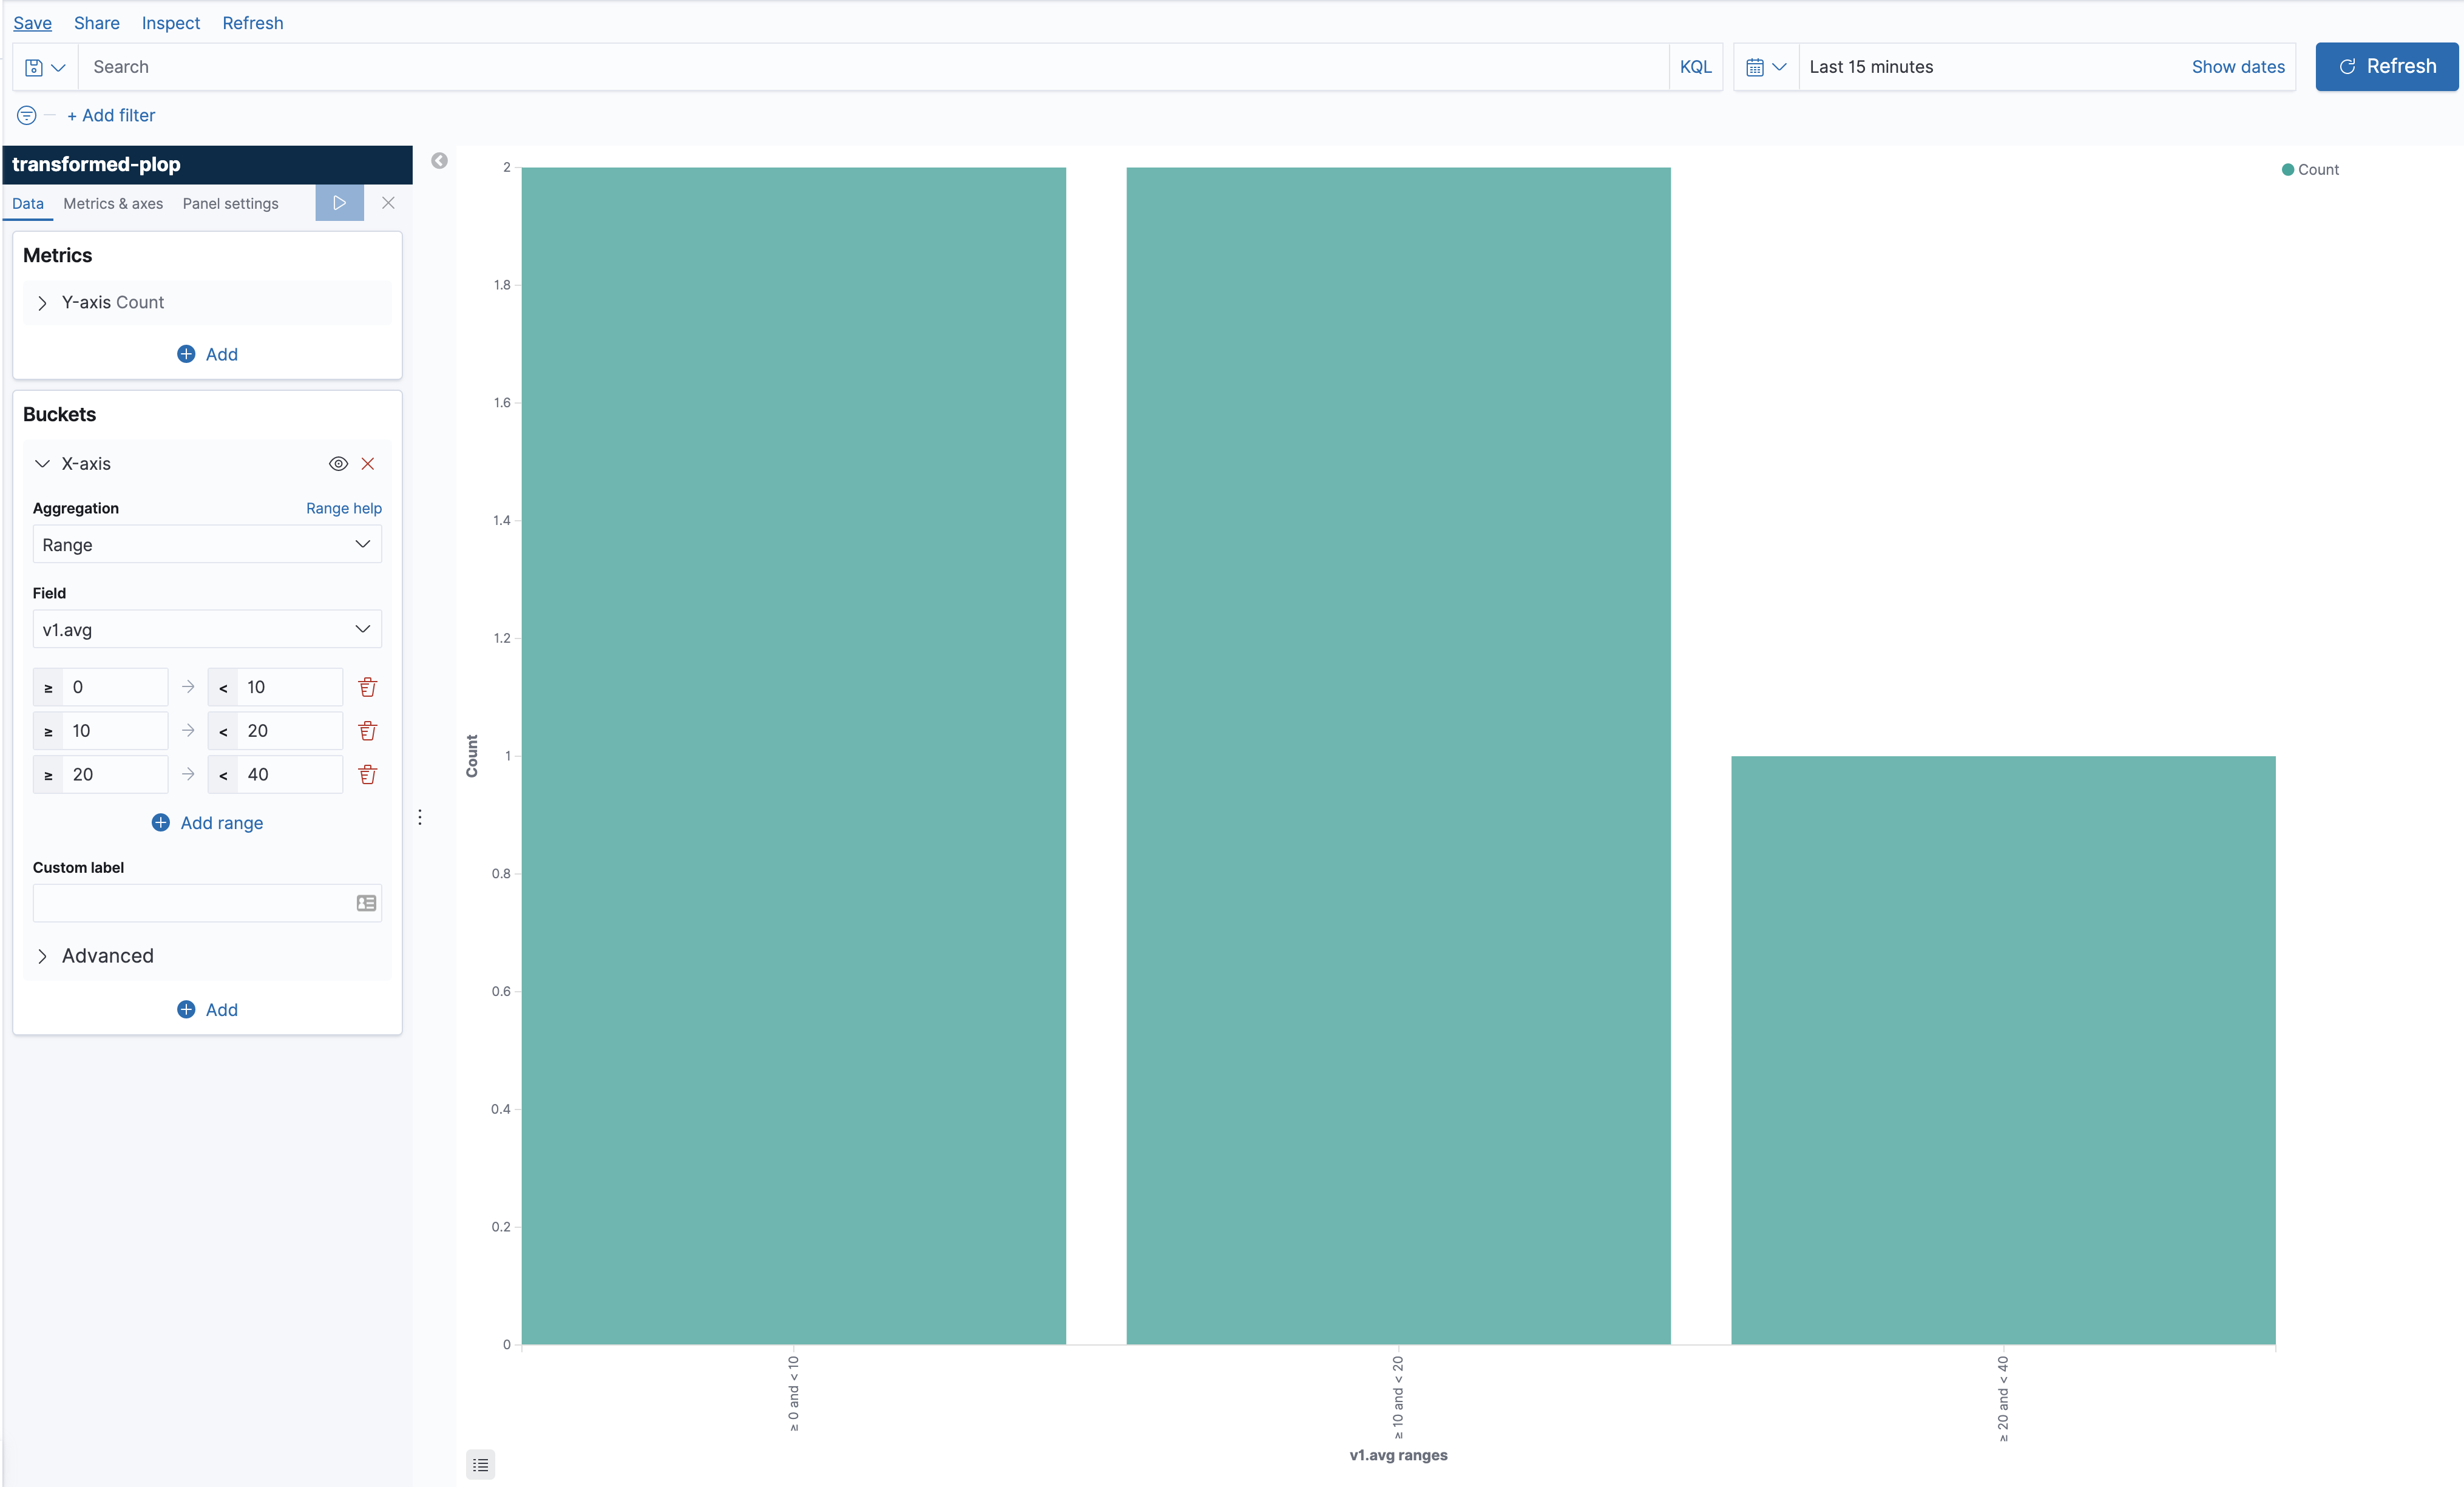
I am trying to show display the repartition of the average of a field across different pre-defined range buckets, according to their type (that is to say, the value of another field)

Here is a diagram showing what I would like the result to be, the result being the graph at the bottom right :


Thanks in advance for your help.
Christophe.

PS : Here is an easy bulk creation of the data to copy/paste into the dev tool, in case you would like to try it yourself :

PUT plop

PUT /plop/_mapping
{
  "properties" :
  {
    "d" : {"type":"date"},
    "v1" : {"type" : "integer"},
    "id" : {"type" : "integer"}
  }
}

POST _bulk
{ "index" : { "_index" : "plop", "_id" : "1" } }
{ "d" : "2019-12-01T10:00:00Z", "v1" : "2" , "id" : 1}
{ "index" : { "_index" : "plop", "_id" : "2" } }
{ "d" : "2019-12-02T10:00:00Z", "v1" : "4" , "id" : 1}
{ "index" : { "_index" : "plop", "_id" : "3" } }
{ "d" : "2019-12-03T10:00:00Z", "v1" : "6" , "id" : 2}
{ "index" : { "_index" : "plop", "_id" : "4" } }
{ "d" : "2019-12-04T10:00:00Z", "v1" : "8" , "id" : 2}
{ "index" : { "_index" : "plop", "_id" : "5" } }
{ "d" : "2019-12-05T10:00:00Z", "v1" : "10" , "id" : 3}
{ "index" : { "_index" : "plop", "_id" : "6" } }
{ "d" : "2019-12-06T10:00:00Z", "v1" : "12" , "id" : 3}
{ "index" : { "_index" : "plop", "_id" : "7" } }
{ "d" : "2019-12-07T10:00:00Z", "v1" : "14" , "id" : 3}
{ "index" : { "_index" : "plop", "_id" : "8" } }
{ "d" : "2019-12-08T10:00:00Z", "v1" : "16" , "id" : 4}
{ "index" : { "_index" : "plop", "_id" : "9" } }
{ "d" : "2019-12-09T10:00:00Z", "v1" : "18" , "id" : 4}
{ "index" : { "_index" : "plop", "_id" : "10" } }
{ "d" : "2019-12-10T10:00:00Z", "v1" : "20" , "id" : 5}

Hey @wokmichel,

Thank you so much for clearly explaining what you're trying to do, AND for providing dev tool commands to get myself setup. It makes it so much easier to help!

The short answer is that you can't do this directly using just a visualization. We need to first create that summarized data set before we can try to visualize it.

How can we create this summarized data set?
Well, "it depends".

What version of Kibana/Elasticsearch are you running?

If you're using >= 7.3, then you can use "Transforms" to do this automatically. If not, then you will likely need an external process which performs an aggregation of your plop data set and ingests it into another index, which you can then visualize on.

I'm going to show you the Transforms approach using version 7.5. The interface looks a bit different in earlier versions, but the process is very much the same. A quick note: Transforms are still in Beta, so that comes with some inherent risk around stability. Assuming that your original dataset is in the plop index, with an index pattern created called plop*:

Create the Transform

  1. Navigate to Management -> Elasticsearch -> Transform, and click the create transform button.
  2. Define the transform pivot. Here, we want to group by id, and aggregate on the average of v1:
    image
  3. Provide transform details. If your data is not static, click the "continuous" slider, so that the transform will always keep your destination index up-to-date. Also ensure that "Create index pattern" is checked, since we want to visualize on the output in Kibana:
  4. Click "Create and Start"!

Create the visualization

Now that the transform is created, we can visualize on the output. In my example above, there is a new index pattern created called transformed-plop:

If you don't have the "buckets" pre-defined, then you can use the "histogram" aggregation to automatically create buckets:


If you know the "buckets" up front, then you can use the "range" aggregation, specifying the ranges to visualize on. This will give you prettier labels than the histogram option above:

1 Like

Hey Gregory, thanks for the super fast and clear answer.
Indeed, I did not mention I am running 7.5.0 and that makes transform the exact feature, that I was not aware of, that I will use a ton, including for other use cases.

In this particular instance, I have try reproducing what you are demonstrating but I am getting a different behavior when defining the transform :
As you can see, the pivot preview does not show the appropriate aggregated data :

Alhtough the data is the same as the one I did provide in my original post :

I understand this is a beta feature but is that a bug or am I missing something ?

Thanks.
Christophe.

@Larry_Gregory : nevermind I have found my mistake (not setting the transform interval)
Thanks a lot for your help this was exactly what I needed !

1 Like

This topic was automatically closed 28 days after the last reply. New replies are no longer allowed.