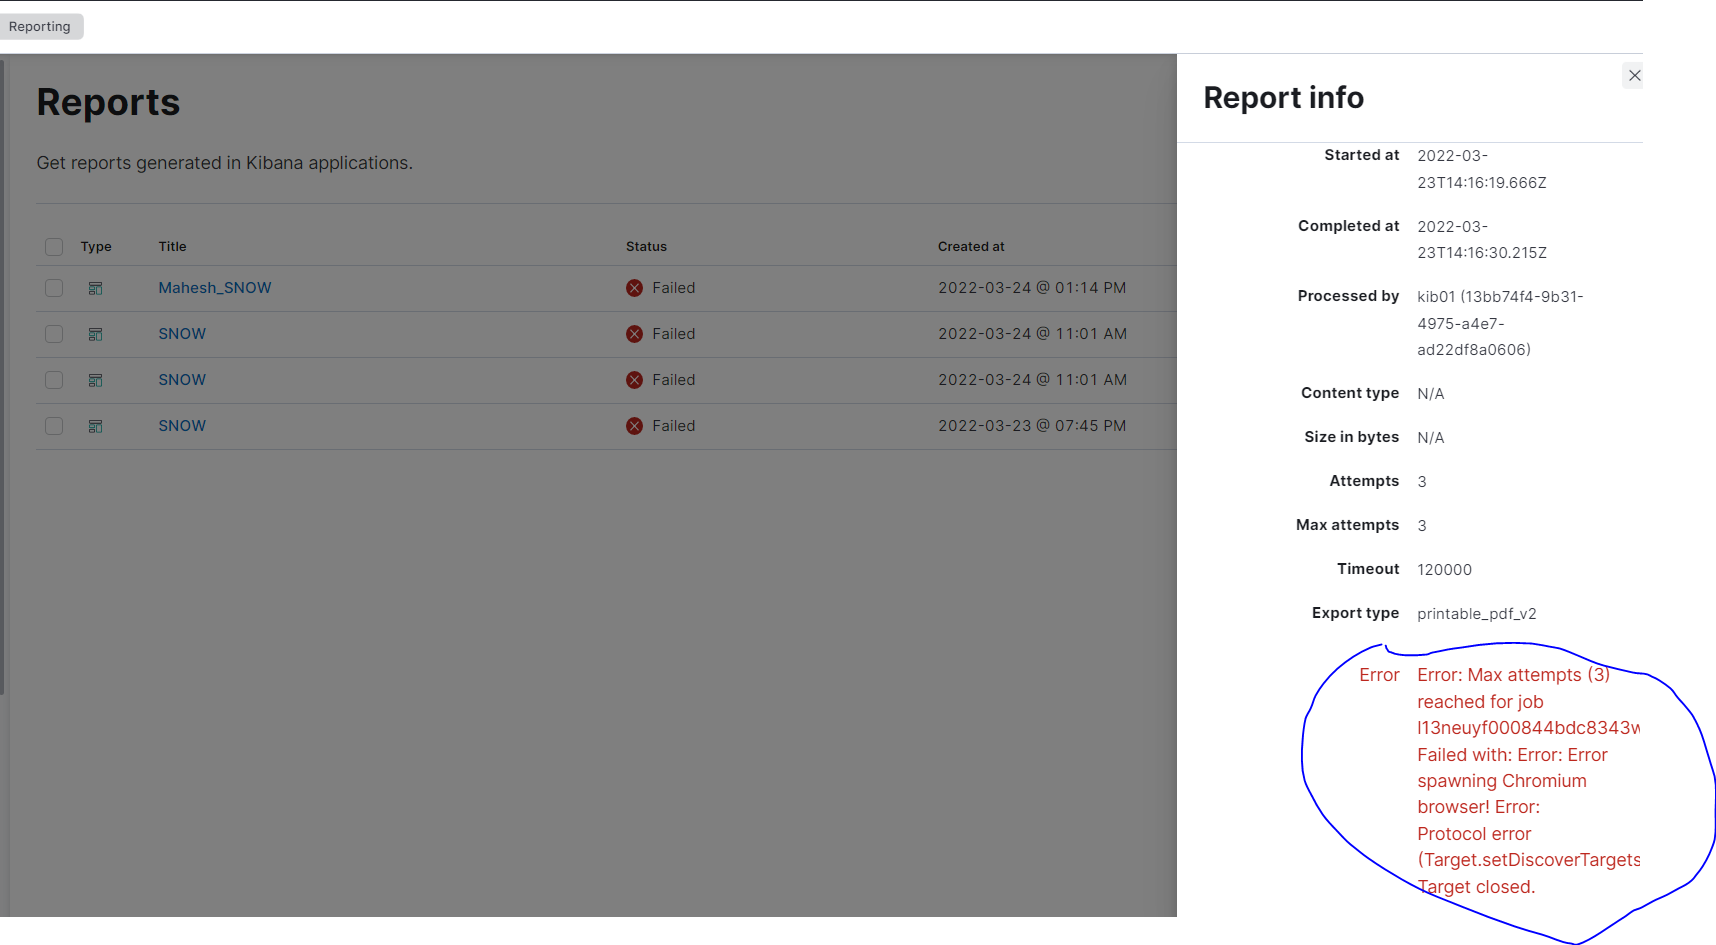
I am having issue in Report generation in Kibana v8. I am running in Docker. Getting like Chromium headless Browser error. After that i had ran Diagnostics. It shows the error that i need to disable sandbox. That also made. Still issue persists.

@tsullivan @Marius_Dragomir do you know whats happening here?
thanks,
Bhavya
Hi, which Docker image are you using? Does the base image have all the dependencies needed for Chromium?
See Configure reporting in Kibana | Kibana Guide [8.11] | Elastic
It shows the error that i need to disable sandbox. That also made.
You shouldn't have to touch this setting, but just to make sure, you entered xpack.reporting.capture.browser.chromium.disableSandbox: true in kibana.yml?
@tsullivan Please check the below. Below was my environment. Kindly help on it.
docker.elastic.co/kibana/kibana 8.0.0
Below was my settings in kibana.yml
server.name: kib01
server.port: 5601
server.host: "0.0.0.0"
elasticsearch.hosts: ["http://es01:9200"]
elasticsearch.username: "kibana_system"
elasticsearch.password: ""
#xpack.actions.enabled: true
xpack.encryptedSavedObjects.encryptionKey: 3334b9d
xpack.reporting.encryptionKey: 6c1a4d1ce*
#xpack.security.encryptionKey: a40203059***
#xpack.actions.enabledActionTypes: ["*"]
xpack.reporting.kibanaServer.hostname: localhost
xpack.reporting.kibanaServer.protocol: http
xpack.reporting.capture.browser.chromium.disableSandbox: true
xpack.reporting.kibanaServer.port: 5601
xpack.reporting.queue.timeout: 60000
Ran into this issue when upgrading from 7.16.2 to 7.17.1 using the official docker image image: docker.elastic.co/kibana/kibana:7.17.1.
It was fixed by adding to kibana.yml:
xpack.reporting.capture.browser.chromium.disableSandbox: true
I have added this parameter even though still facing issue.
Strange ![]() ..
..
A difference between my configuration and yours is I have not defined any of the following settings
xpack.reporting.kibanaServer.hostname:
xpack.reporting.kibanaServer.protocol:
xpack.reporting.kibanaServer.port:
Could you try and disable those and see if it still happens?
Yes i have tried earlier.. no success thats why added those also
@tsullivan any updates here. Need your inputs to fix this issue
How much RAM is available to the docker container? You'll want to start with 8 GB.
Do you have a customized config/node.options file? If so can you provide the contents of it please?
This seems strange. The Kibana reporting features should work without having to add any config properties. I filed an issue to investigate this: [Reporting] Could not generate screenshot reports without manually disabling Chromium sandbox · Issue #129148 · elastic/kibana · GitHub
## Node command line options
## See `node --help` and `node --v8-options` for available options
## Please note you should specify one option per line

## max size of old space in megabytes
#--max-old-space-size=4096

## do not terminate process on unhandled promise rejection
 --unhandled-rejections=warn
@tsullivan Kindly help on it. Do you really need 8GB of RAM??
It's not me ![]() it's Chromium that needs it. When someone is on their laptop/desktop and using Kibana, they usually have 4-32GB. When they load a dashboard, it's done within an acceptable amount of time. If they try with a 1GB laptop, the browser wouldn't have enough resources to load Kibana or lanuch at all. The same principle is the case if you have a 1 GB server (I'm not saying you have 1GB - I don't know what you have).
it's Chromium that needs it. When someone is on their laptop/desktop and using Kibana, they usually have 4-32GB. When they load a dashboard, it's done within an acceptable amount of time. If they try with a 1GB laptop, the browser wouldn't have enough resources to load Kibana or lanuch at all. The same principle is the case if you have a 1 GB server (I'm not saying you have 1GB - I don't know what you have).
Chromium gets the "remainder" of memory not reserved by Kibana. In practice, it looks like Kibana rarely needs more than 1.5 GB of RAM. You can control the max memory that Kibana can reserve with the --max-old-space-size=4096 line in config/node.options