I trying to get top N of errors from all logs entries with data table visualisation. But, I don't have the "message.raw" field that is available for aggregation.
I made a copy of "message" field with this trick in the Logstash configuration:
mutate {
      add_field => [ "msg", "%{message}" ]
}
Now I have two fields "msg" (analysed) and "msg.raw" (not analysed).
In the "discover" tab I see both "message" and "msg" fields with the same content, for example "Processing failed."
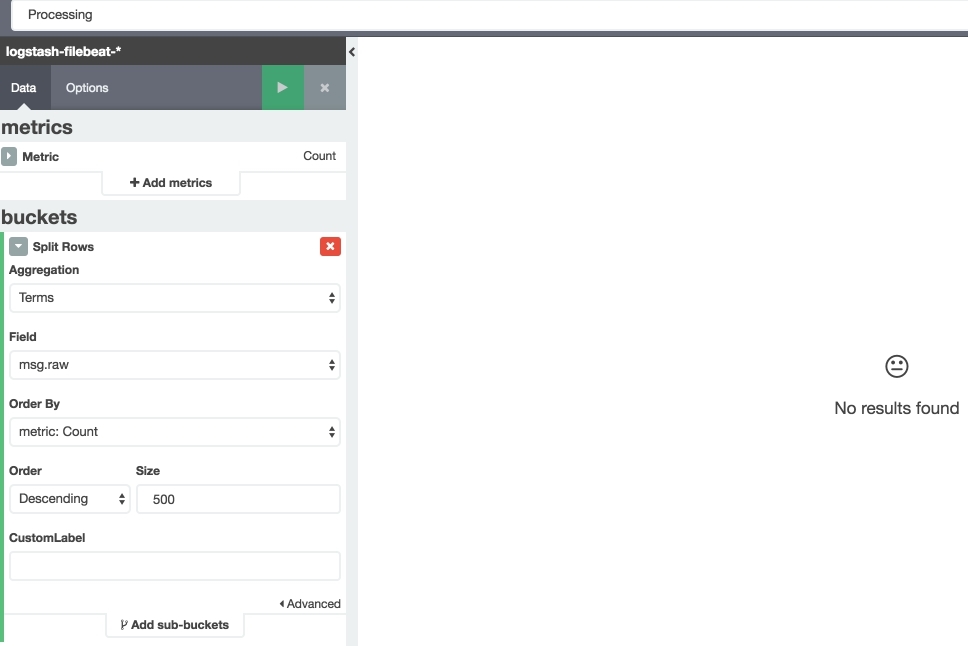
Then I created a data table visualisation with a metric "count" and "Split rows" by field "msg.raw" with "size: 500".
After execution, I see a list of some of the log entries, but not all. And I didn't see the "Processing failed." message at all.
I have the same time filter and when I trying to filter data table visualisation by text "Processing" I have "No results found" response.
What is most correct way to get the table with all log messages aggregated and sorted by count or something like on the screen?:
Is the terms agg on "msg.raw" the only aggregation you have on the table vis?
If you're not seeing the "Processing failed" errors in the visualization, then it's not too surprising that search for them doesn't find any matches. If you use the same time range and go to discover, does putting "Processing" in the query bar return any results.
It sounds like what you are doing is correct, doing a terms agg on msg.raw. The size might be larger than it needs to be, but it shouldn't have any negative effects on the results.
Yes, I tried to make the chart many times with different ways and with single aggregation too. And I see the msg in "discover" mode, but not in the "data table". =(
I don't think so. That size just controls the number of records that Elasticsearch will look for. It may slow the request down, but it shouldn't affect the searching. Mixed with the query, the size would limit the results with that query.
What are you putting in the query bar for the visualization? Just "processing," like so?
I mean "size" as "msg" field length. It contains around 1000 chars in reality.
Ah, sorry. I don't think that should matter either, but I'm honestly not super familiar with the internals of Elasticsearch, so there might be a character limit for searching. I doubt that limit, if it exists, is as low as 1000 characters though.
Can you show me the sidebar for the table visualization you are creating? I'd like to see how the metrics and aggregations are set up.
Ah. The images you posed got formatted very strange here, I didn't notice there was a third image there. Sorry about that.
Yeah, this is dead simple, and I would expect it to work. If you look at that field in Settings > indices, is the analyzed field not checked? I suspect it's not, since it would be weird if you had a .raw field that was analyzed.
Can you maybe try querying msg in the query bar, by using msg:processing, and seeing it that works?
Maybe there's something that happens with the query bar when you have an aggregation on a not_analyzed field... seems odd, but I'm kind of out of ideas.
Today I have added a new field "message_sha1" to logstash configuration.
And when I change my data table field from "msg.raw" to "message_sha1.raw", I see all rows. But if I add yet another sub-aggregation level by "msg.raw" field, the rows with a big length of "msg.raw" are disappearing.
So, I think, the main problem is a length of "msg.raw".
Apache, Apache Lucene, Apache Hadoop, Hadoop, HDFS and the yellow elephant
logo are trademarks of the
Apache Software Foundation
in the United States and/or other countries.


 It is a little strange side-effect of css styling on this page.

