Hi, I installed tar.gz kibana 4.6.1 , i didn't have problem.
And, when i installed rmp Kibana 4.6.1 for linux_64, the DiScover tab is off when you click.
Are there configuration to do on Kibana file ?
Thanks,
Hi, I installed tar.gz kibana 4.6.1 , i didn't have problem.
And, when i installed rmp Kibana 4.6.1 for linux_64, the DiScover tab is off when you click.
Are there configuration to do on Kibana file ?
Thanks,
What do you mean by it being "off"
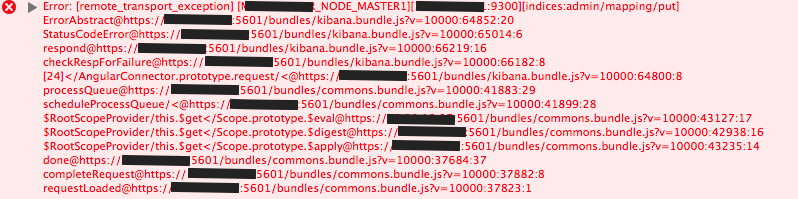
Are there any errors being printed out in the browser debugging console?
Discover page doesn't need any configuration. Was there anything in the configuration that you changed around when this started happening?
Ah yes sorry,
I mean that when i click on Discover Tab, nothing is happening ( others tabs work ).
I didn't make any configuration about this.
I tried in Kibana 4.5.4 rpm too... same problem
{"type":"response","@timestamp":"2016-09-20T14:18:26+00:00","tags":,"pid":3705,"method":"put","statusCode":400,"req":{"url":"/elasticsearch/.kibana/_mapping/search","method":"put","headers":{"host":"10.30.19.9:5601","user-agent":"Mozilla/5.0 (Macintosh; Intel Mac OS X 10.10; rv:39.0) Gecko/20100101 Firefox/39.0","accept":"application/json, text/plain, /","accept-language":"fr,fr-FR;q=0.8,en-US;q=0.5,en;q=0.3","accept-encoding":"gzip, deflate","dnt":"1","content-type":"application/json;charset=utf-8","kbn-version":"4.5.4","referer":"https://10.30.19.9:5601/app/kibana","content-length":"271","connection":"keep-alive"},"remoteAddress":"10.30.19.254","userAgent":"10.30.19.254","referer":"https://10.30.19.9:5601/app/kibana"},"res":{"statusCode":400,"responseTime":12,"contentLength":9},"message":"PUT /elasticsearch/.kibana/_mapping/search 400 12ms - 9.0B"}
I specify that logs recover,dahsboards and visualizations creation work correctly. There is problem just from Discover TAB.
I removed .kibana index and tried again, always the same issue..
Do you see any errors in the JavaScript console of your browser?
Looks like you are experiencing the bug documented in this Github issue: https://github.com/elastic/kibana/issues/5648
Have you tried removing the .kibana index?
Yes. It was the same things.
But the error is in my side, because i have a script which install with bulk curl method, all default dashboards, visualisations, index-pattern etc..
for default index-pattern i send this :
{"index":{"_index":".kibana","_type":"config","_id":"4.5.4"}}
{"buildNum":"9518","defaultIndex":"ubilogs-*","timepicker:timeDefaults":"{\n "from": "now-48h",\n "to": "now",\n "mode": "quick"\n}"}
and kibana complete automatically fields.
So for this case there is always mapping conflict.
The best practise, is to make (usually  ) the index-pattern recovering and then launch your script object installation ( if like me, you have an automatic installation about dashboards, visualizations,timeFilter,index-pattern,etc.....).
Thanks,
© 2020. All Rights Reserved - Elasticsearch
Apache, Apache Lucene, Apache Hadoop, Hadoop, HDFS and the yellow elephant logo are trademarks of the Apache Software Foundation in the United States and/or other countries.