We have a setup where Flink is writing to Elasticsearch, and at sporadic moments latency increases due to volume of IOPS. Looking for suggestions.
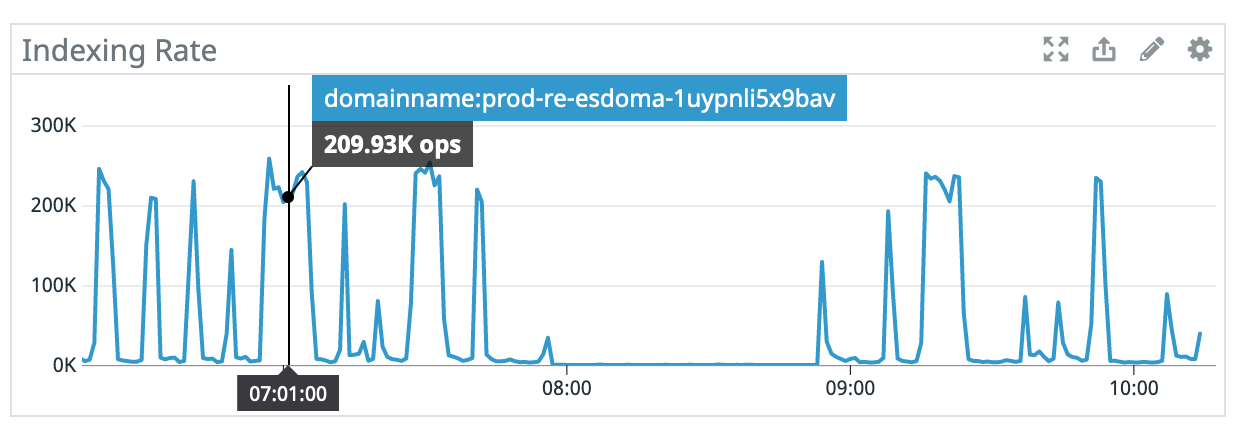
Attached are some graphs, when IOPS are high, indexing latency is high, and the backpressure means Flink sends far less bulk indexing requests. This in turn dramatically drops our indexing rate. It would appear that certain requests require a lot more IOPS. What suggestions are there to tune or adjust hardware for this scenario?
Thanks
Marked times ~7:00 to demonstrate that lower IOPS == low latency == more requests == dramatically higher indexing rate
refresh interval is set to 1s because plan is to soon launch to users and we need low latency searches. It is expected to have similar read and write volume since users will search, and then perform some action that will then change the what's in ES.
Hmm. The fact that you immediately pointed me to hot_threads and they did not when I asked for help gives me less confidence in them, but much in you. Assuming this wasn't AWS, what path do you think I should follow?
I would change my storage type and see if that helps.
You can also try out https://www.elastic.co/cloud/ and see if that performs better. We provide a fair bit more on top of the core Elasticsearch product as well.
We now believe latency increases are related to the garbage collector collecting garbage (at least this appears to be 1 significant factor). We're on ES 7.8, anything recommendations?
May be jumping the gun on garbage collection. The graphs line up in some places but not others. Are there any good recommendations for dealing with large merges?
Just noticed something else though, looking at latency metrics per node, only 2 of our nodes have high latency, and cpu is higher on those 2 nodes (but wouldn't say high). Our Flink job has a parallelism of 2. I assumed ES load balances write bulk requests, is this not the case?
Shard allocation between shards looks relatively even, though two shards are slightly larger than the rest
<index>       4     r      STARTED 30349634  8.5gb x.x.x.x  aff85c512e914917c29faa78df1c6831
<index>       4     p      STARTED 30349634  8.3gb x.x.x.x  55d01cfcbccb60959a00b0ad437a9b36
<index>       1     r      STARTED 30348482  8.6gb x.x.x.x   f17701275c28068a719b2be5e29e5d06
<index>       1     p      STARTED 30348482  8.5gb x.x.x.x  55d01cfcbccb60959a00b0ad437a9b36
<index>       3     p      STARTED 30345095 10.4gb x.x.x.x  d21c192794d2d51cbb2b5951fdcb18fe
<index>       3     r      STARTED 30345095 10.9gb x.x.x.x 6cf4a3474c179f2dc2721d120eb380a3
<index>       2     r      STARTED 30340807  9.9gb x.x.x.x   f17701275c28068a719b2be5e29e5d06
<index>       2     p      STARTED 30340807  9.9gb x.x.x.x 6cf4a3474c179f2dc2721d120eb380a3
<index>       0     p      STARTED 30344671    8gb x.x.x.x c802556d0108779bb85051acac16b771
<index>       0     r      STARTED 30344671  8.2gb x.x.x.x  d21c192794d2d51cbb2b5951fdcb18fe
Once the node that gets it parses the request, it sends data to each relevant shard in the cluster. It doesn't take (eg) half of the request and pass it to another node straight away.
Apache, Apache Lucene, Apache Hadoop, Hadoop, HDFS and the yellow elephant
logo are trademarks of the
Apache Software Foundation
in the United States and/or other countries.