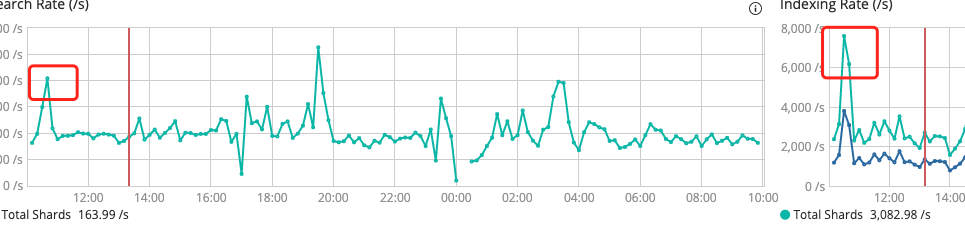
i found a datanode search thread pool has rejected,but grafana monitor show that moment search threap_pool ’s active(size=49) and queue(size=2000) is not full,I can't understand why ,please help me。thanks a lot...

Welcome to our community! 
What is the output from the _cluster/stats?pretty&human API?
We need to see the whole thing please.
You have a pretty large cluster there!
What is the output from _cat/threadpools?v and hot threads when you get these rejections?
You should upgrade, 7.10 is relatively old and latest is 7.14.
From grafana i can see active and pool is not full but rejected happened。i'm sorry for i can‘t get hot thread info in that moment。 and is there some thing can cause this problem?
That's hard to say without more info.
OK,Thank you for your reply anyway。