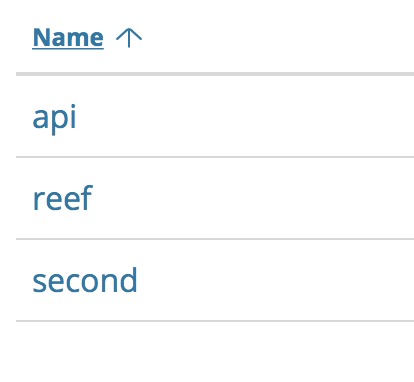
I have a service called second-reef-api, and amusingly this showed up:
Is there a way to correct this post-hoc or do I have to rename my service to SecondReefAPI?
I have a service called second-reef-api, and amusingly this showed up:
Is there a way to correct this post-hoc or do I have to rename my service to SecondReefAPI?
Hi Kurtis,
Can you please provide some more information on your application, and Elastic Stack setup? Which agent? Which stack version? We use various testing services which have hyphenated names which do not exhibit this behaviour.
Can you tell me which language agent you are using and which version of that agent, apm-server, elasticsearch and kibana?
# docker-compose.yml
  apm-server:
    image: docker.elastic.co/apm/apm-server:6.5.2
  elasticsearch:
    image: docker.elastic.co/elasticsearch/elasticsearch:6.5.2
  logstash:
    image: docker.elastic.co/logstash/logstash:6.5.2
  kibana:
    image: docker.elastic.co/kibana/kibana:6.5.2
# Gemfile
gem "elastic-apm", "2.1.2"
# config/elastic_apm.yml
# Set service name - allowed characters: a-z, A-Z, 0-9, -, _ and space
# Defaults to the name of your Rails app
service_name: "second-reef-api"

# Set custom APM Server URL (default: http://localhost:8200)
server_url: 'https://apm.ie'
I tried to reproduce this using a simple rails app and configuring the same service name, but the service showed up just fine.
Your docker-compose file indicates that logstash is involved in the process somehow. Did you change any of the default settings for the server and if so, could you please share what you've changed.
Hi Kurtis
Can you try running this query in Kibana Dev Tools:
GET apm*/_search
{
  "size": 0,
  "aggs": {
    "serviceName": {
      "terms": {
        "field": "context.service.name",
        "size": 10
      }
    }
  }
}
That'll help us diagnose if the names are already split when indexed in Elasticsearch, or if this happens afterwards.
Thank you.
{
  "took" : 359,
  "timed_out" : false,
  "_shards" : {
    "total" : 5,
    "successful" : 5,
    "skipped" : 0,
    "failed" : 0
  },
  "hits" : {
    "total" : 45949,
    "max_score" : 0.0,
    "hits" : [ ]
  },
  "aggregations" : {
    "serviceName" : {
      "doc_count_error_upper_bound" : 0,
      "sum_other_doc_count" : 0,
      "buckets" : [
        {
          "key" : "api",
          "doc_count" : 44614
        },
        {
          "key" : "reef",
          "doc_count" : 44614
        },
        {
          "key" : "second",
          "doc_count" : 44614
        },
        {
          "key" : "sr",
          "doc_count" : 1333
        },
        {
          "key" : "bouncer",
          "doc_count" : 1099
        },
        {
          "key" : "authentication",
          "doc_count" : 222
        },
        {
          "key" : "warehousing",
          "doc_count" : 12
        }
      ]
    }
  }
}
No, my logstash is very simplistic.
No, my logstash is very simplistic.
Even so, if you could provide your apm-server.yml and logstash config, that might help us identify the issue. None of us have been able to reproduce the issue. It's probably something subtle.
Alright, I've done my best to gather all the configurations of my monitoring server: https://gist.github.com/krainboltgreene/cd7afac60a84c92e2eeaee0ba588a11d
© 2020. All Rights Reserved - Elasticsearch
Apache, Apache Lucene, Apache Hadoop, Hadoop, HDFS and the yellow elephant logo are trademarks of the Apache Software Foundation in the United States and/or other countries.