Hello,
Looking for some suggestions on how to tackle some performance issues. I'll give a quick summary of the issues we are seeing and then follow up with the details about our configuration:
We are seeing bad GC performance on most of our nodes. Here's an example from node3 (we have 4 nodes):

As you can see, we are stuck around the 75% utilization mark. The node is constantly trying to clear up space, but failing. Here's some output from the GC log:
2017-04-25T15:47:14.529+0000: 4908696.646: [CMS-concurrent-sweep-start]
2017-04-25T15:47:16.381+0000: 4908698.497: [CMS-concurrent-sweep: 1.852/1.852 secs] [Times: user=1.97 sys=0.00, real=1.85 secs]
2017-04-25T15:47:16.381+0000: 4908698.497: [CMS-concurrent-reset-start]
2017-04-25T15:47:16.392+0000: 4908698.509: [CMS-concurrent-reset: 0.011/0.011 secs] [Times: user=0.01 sys=0.00, real=0.02 secs]
2017-04-25T15:47:18.392+0000: 4908700.508: [GC (CMS Initial Mark) [1 CMS-initial-mark: 4827897K(5950720K)] 4989708K(6257408K), 0.0080391 secs] [Times: user=0.02 sys=0.00, real=0.00 secs]
2017-04-25T15:47:18.400+0000: 4908700.517: [CMS-concurrent-mark-start]
2017-04-25T15:47:18.542+0000: 4908700.659: [GC (Allocation Failure) 2017-04-25T15:47:18.542+0000: 4908700.659: [ParNew
Desired survivor size 17432576 bytes, new threshold 6 (max 6)
- age   1:    2137280 bytes,    2137280 total
- age   2:     600304 bytes,    2737584 total
- age   3:     402168 bytes,    3139752 total
- age   4:     406696 bytes,    3546448 total
- age   5:    1698048 bytes,    5244496 total
: 284668K->8344K(306688K), 0.0117950 secs] 5112565K->4836241K(6257408K), 0.0119079 secs] [Times: user=0.05 sys=0.00, real=0.01 secs]
2017-04-25T15:47:24.278+0000: 4908706.395: [CMS-concurrent-mark: 5.862/5.878 secs] [Times: user=7.42 sys=0.01, real=5.88 secs]
2017-04-25T15:47:24.278+0000: 4908706.395: [CMS-concurrent-preclean-start]
2017-04-25T15:47:24.295+0000: 4908706.411: [CMS-concurrent-preclean: 0.015/0.016 secs] [Times: user=0.03 sys=0.00, real=0.02 secs]
2017-04-25T15:47:24.295+0000: 4908706.412: [CMS-concurrent-abortable-preclean-start]
2017-04-25T15:47:25.372+0000: 4908707.489: [GC (Allocation Failure) 2017-04-25T15:47:25.372+0000: 4908707.489: [ParNew
Desired survivor size 17432576 bytes, new threshold 6 (max 6)
- age   1:    8805664 bytes,    8805664 total
- age   2:    1080224 bytes,    9885888 total
- age   3:     413984 bytes,   10299872 total
- age   4:     399160 bytes,   10699032 total
- age   5:     242432 bytes,   10941464 total
- age   6:    1693864 bytes,   12635328 total
: 280984K->14818K(306688K), 0.0130235 secs] 5108881K->4842715K(6257408K), 0.0131792 secs] [Times: user=0.04 sys=0.00, real=0.01 secs]
Here is a snapshot of the GC activity on all four nodes (light purple is node3):

I'm expecting to see a sawtooth pattern on the heap graph (at the top of this post). I'm seeing this same behavior on all four nodes.
Now for the configuration....
- We are running v2.3.
- We have a 4 node cluster with 15 shards and 2 replicas.
- We have around 625,000 documents.
- We have our heap set at 6G (-Xms6g -Xmx6g).
- We are running on 4 EC2 t2.xlarge instances (4 vCPU and 16G memory).
- Data is stored on an encrypted volume, 100G gp2 with 300 IOPS.
- We are doing full text searching and some aggregations.
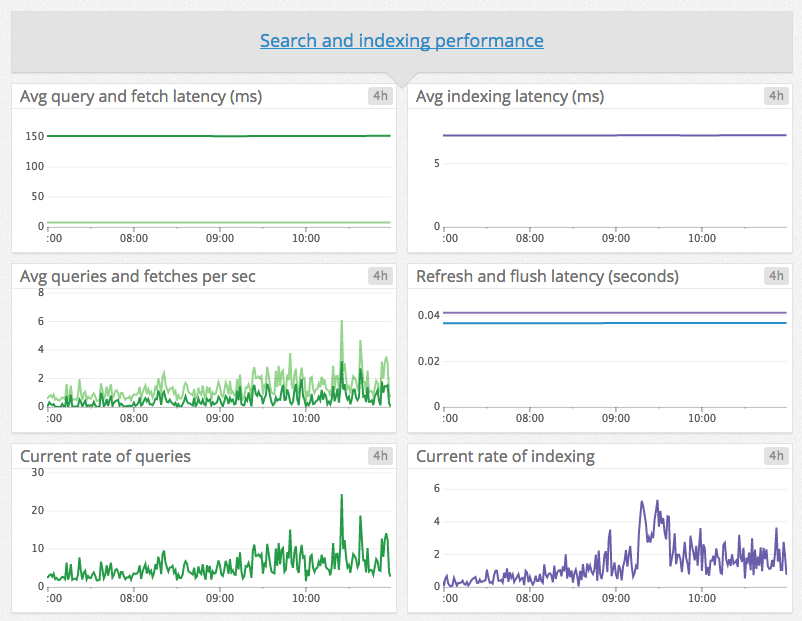
We are consistently indexing new docs and updating/deleting already indexed data. The volume is pretty low, but it's consistent throughout the day:
Happy to provide any more details that might be helpful.
My questions:
- Why is GC so flat (actually slowly increasing)?
- What are the best EC2 instances to run?
- Do we have too many shards? (15 was a guess we made about 2 years ago and just haven't played with)