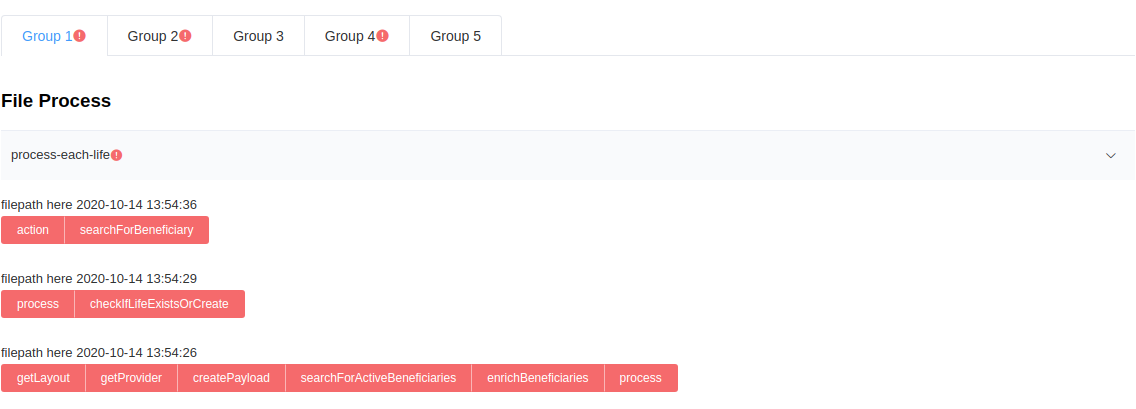
I'd like to know if it is possible to create a visualization in kibana like the print below.
The idea is, I have group of logs, then I can have subprocess logs for its groups and then executions for subprocess. And I should be able to view it hierarchically and grouped.
Apache, Apache Lucene, Apache Hadoop, Hadoop, HDFS and the yellow elephant
logo are trademarks of the
Apache Software Foundation
in the United States and/or other countries.