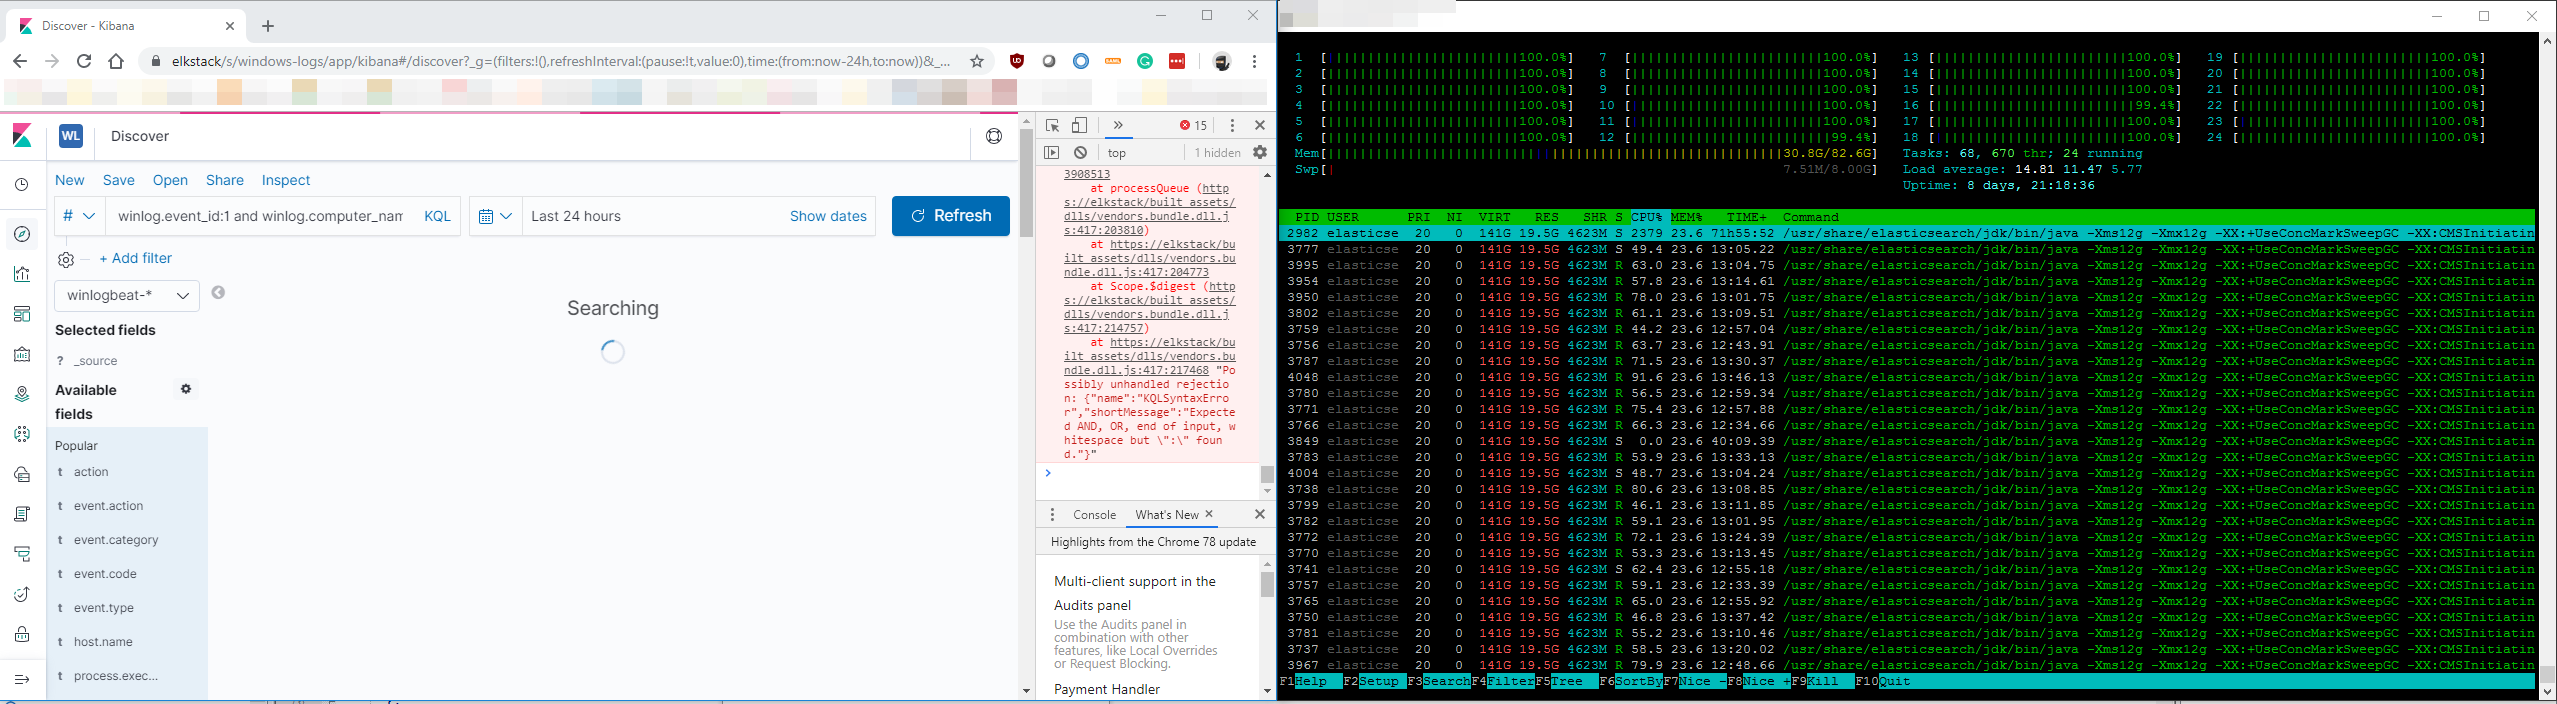
I have even disabled highlighting in kibana settings to check on performance then, but... it has no impact at all (it was suggested in one of answers above).
I see the discover vs console examples are querying different date ranges and timestamps - to further diagnose we need to get these requests as close to each other as possible.
The other thing to ensure is that caching is not taking effect. In console you can do this:
GET myindex/_search?request_cache=false
Another difference between Discover and Console is that Discover will route user requests to the same choice of replica using the preference parameter (you can see this value using the Browser's network tools).
In your Console test, set ?preference=xxxx with the same session id used by the Discover tab.
No, yes... a little Few posts above I tried to reconfigure it from 1 shard and 0 replicas to 5 shards and 1 repl - I thought that maybe then it will run some search jobs in pararell increasing the overall performance, but... it had no impact.
If you only have a single node you'll never get any replicas (there's no added resilience or throughput benefits in allocating replica shards to the same node as the primary shard).
So I guess we can rule out any preference difference between Discover and Console.
It might be worth noting Kibana's description of timings. I wonder if there's added overhead in the unpacking of all that JSON in the 500 doc results (did we already establish performance was linear with the size setting for hits?)
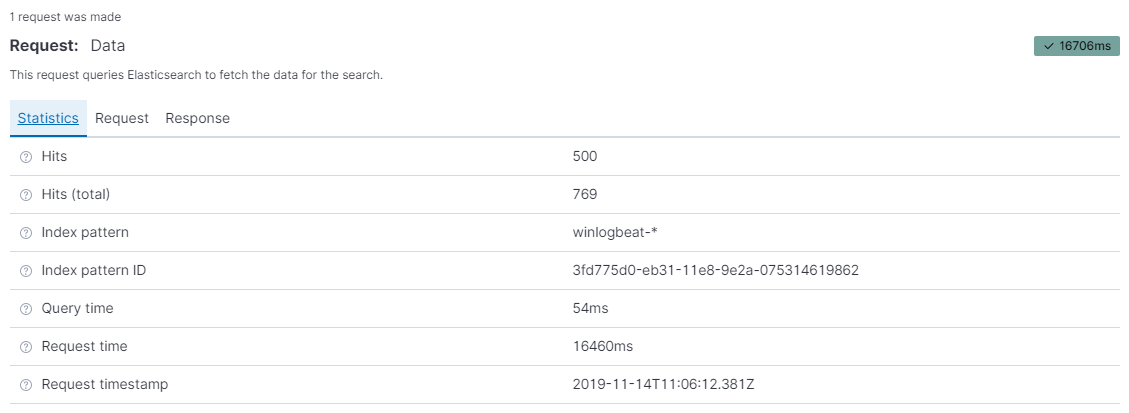
ah, then, basing on last query output it looks like
ES query takes only 54ms - super fast
and then preparing all json docs takes 16460ms ...correct?
I would test that with different sizes as you proposed, but doing that in devtools/console would not give me results I'm looking for (preparing docs).
If I do that from the discovery tab in kibana I can change size in advanced settings, but.... results are cached and each subsequent query for same data is faster. How do I disable cache over there?
If the suspicion is that it's all the JSON marshalling that takes the time the elasticsearch caches may be somewhat irrelevant. That said, there's an API you can use to clear the caches
After analyzing the website type and traffic, we tweak the key settings in MySQL servers that helps to ensure optimal resource usage. This includes connection limits, buffer size and query cache size, and more.
@Mark_Harwood, @DavidTurner - first of all, thank for you all your hints here finally some good news here
Got it fixed - I have disabled filterEditor:suggestValues in Kibana settings so KQL won't suggest values in discovery search and problem is gone.
Finally it all works as it should, question is - shouldn't this feature get reported as a buggy? As I read in other threads it looks up all indicies instead of those specified in time range picker which causes such CPU load.
Anyway - I hope that this workaround will help others having same issue with ELK 7.
Apache, Apache Lucene, Apache Hadoop, Hadoop, HDFS and the yellow elephant
logo are trademarks of the
Apache Software Foundation
in the United States and/or other countries.


 finally some good news here