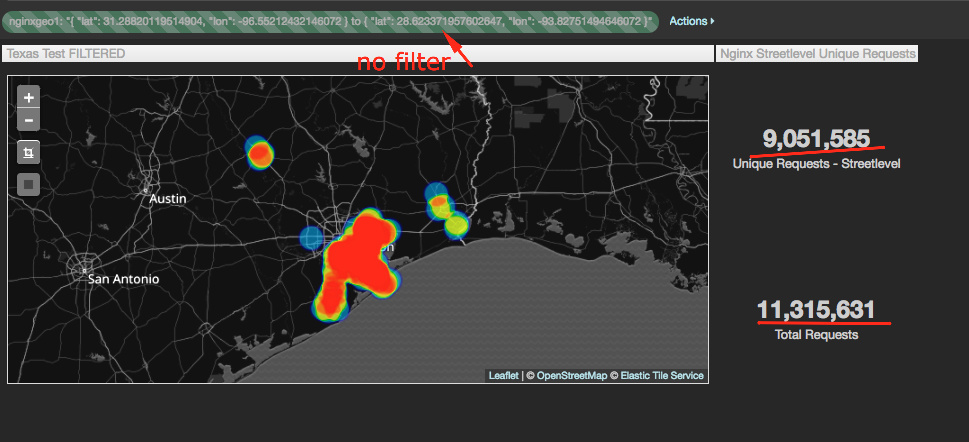
I have a tilemap visualization on a dashboard in Kibana 5.3.0 displaying results properly as seen below. The issue is that when I try to add a geo filter (to geofence the data I'm returning), everything displays properly but I get a warning at the top of the page:

The full error can be seen below. Now before you ask me "is your geo_point, 'nginxgeo1' in your logstash index?" No, no it is not and has never been. The geopoint is in my nginx index (e.g. nginx-2017.05.05), completely separate from my logstash index. This error only arises when I attempt to add a geo filter in order to limit my results.
The geo filter:
{
  "geo_bounding_box": {
    "nginxgeo1": {
      "top_left": {
        "lat": 30.5696,
        "lon": -96.5481
      },
      "bottom_right": {
        "lat": 28.64264,
        "lon": -94.3371
      }
    }
  }
}
Error: Request to Elasticsearch failed: {"error":{"root_cause":[{"type":"query_shard_exception","reason":"failed to find geo_point field [nginxgeo1]","index_uuid":"ar4OOB7RSLaYv2XXjc9Zsg","index":"logstash-2017.05.04"},{"type":"query_shard_exception","reason":"failed to find geo_point field [nginxgeo1]","index_uuid":"XCBfKpp-TmWWTR71pTuVsg","index":"logstash-2017.05.05"}],"type":"search_phase_execution_exception","reason":"all shards failed","phase":"query","grouped":true,"failed_shards":[{"shard":0,"index":"logstash-2017.05.04","node":"aC2_igyIQPivgRcTNEaMCQ","reason":{"type":"query_shard_exception","reason":"failed to find geo_point field [nginxgeo1]","index_uuid":"ar4OOB7RSLaYv2XXjc9Zsg","index":"logstash-2017.05.04"}},{"shard":0,"index":"logstash-2017.05.05","node":"aC2_igyIQPivgRcTNEaMCQ","reason":{"type":"query_shard_exception","reason":"failed to find geo_point field [nginxgeo1]","index_uuid":"XCBfKpp-TmWWTR71pTuVsg","index":"logstash-2017.05.05"}}],"caused_by":{"type":"query_shard_exception","reason":"failed to find geo_point field [nginxgeo1]","index_uuid":"XCBfKpp-TmWWTR71pTuVsg","index":"logstash-2017.05.05"}},"status":400}
    at http://opuscache/bundles/kibana.bundle.js?v=14823:28:19338
    at Function.Promise.try (http://opuscache/bundles/commons.bundle.js?v=14823:75:22403)
    at http://opuscache/bundles/commons.bundle.js?v=14823:75:21773
    at Array.map (native)
    at Function.Promise.map (http://opuscache/bundles/commons.bundle.js?v=14823:75:21728)
    at callResponseHandlers (http://opuscache/bundles/kibana.bundle.js?v=14823:28:18950)
    at http://opuscache/bundles/kibana.bundle.js?v=14823:28:7080
    at processQueue (http://opuscache/bundles/commons.bundle.js?v=14823:38:23621)
    at http://opuscache/bundles/commons.bundle.js?v=14823:38:23888
    at Scope.$eval (http://opuscache/bundles/commons.bundle.js?v=14823:39:4619)
My question is this:
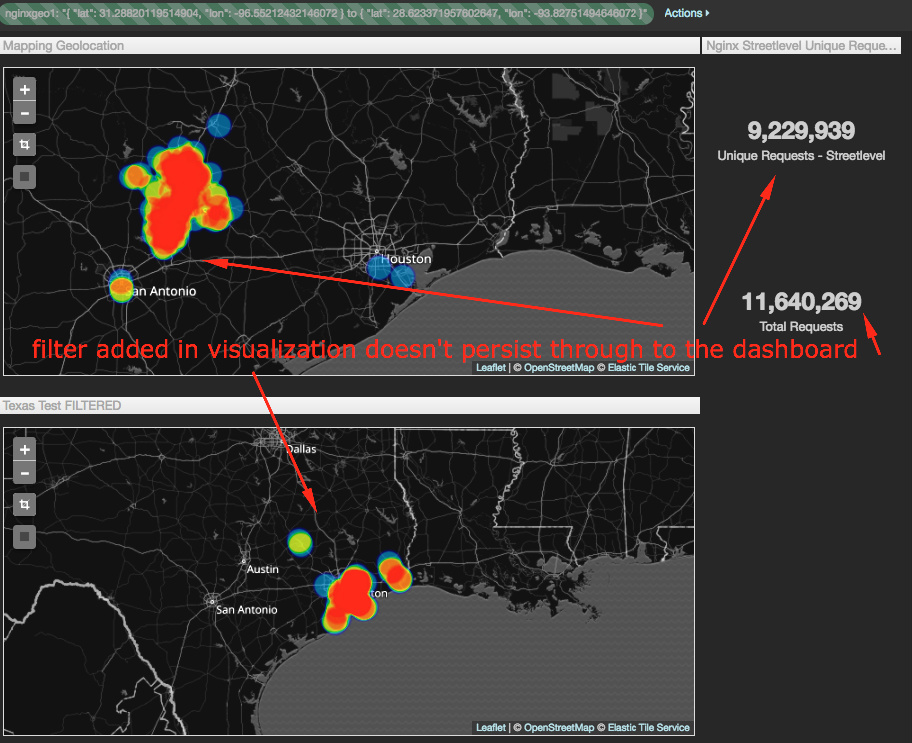
Is there a way to add a filter for the geo_bounding_box to only search in the nginx indices? I don't have any metrics on this dashboard being populated from Logstash.