I just upgraded from Kibana 4.1 to Kibana 4.2.
By the way, I also upgraded Logstash and Elasticsearch to 2.0 (from 1.x).
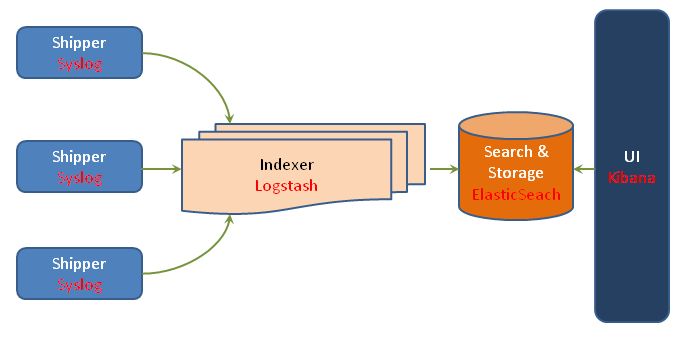
I use this solution to collect logs from firewalls through syslog input and then some simple logstash filtering.
I also use curator to close indices older than 2 days in order to keep a reactive solution.
My solution is hosted on a DELL dedicated server with 4 core CPU and 6 Gb RAM (enough to keep 3 indices open).
Now that I have upgraded, I am facing 2 major problems :
I have about 3 minutes delay between the time where the message is issued and the time it appears in kibana
the messages volume has really really fallen down, see the chart below showing the message volume for the last 24 hours. One can see that the message volume has dropped significantly after upgrade.
It's recommended as it breaks up your pipeline and lets you do downstream maintenance without worrying about data loss. It also helps if you get a large influx of events.
The reason I asked is that you can then also monitor your broker and make sure all the events are making it through.
I tried to install a broker and a second logstash instance playing as a shipper, sending syslog events to redis server.
My logstash indexer was then supposed to read from redis and send to elasticsearch.
I didn't succeed to make it work.
Il will try this later because having a broker seems to be really interresting.
The fact is I found what was causing my initial problem.
The logstash parameter "template_overwrite" was set to true.
Commenting this line solved my problem.
Thanks for your help and advice about broker.
Have a nice day
Apache, Apache Lucene, Apache Hadoop, Hadoop, HDFS and the yellow elephant
logo are trademarks of the
Apache Software Foundation
in the United States and/or other countries.