Sql query with like in "elasticSearch Sql" bugs?

i' ve simple query but not have resulset with

SELECT * FROM "errors_prima*"

where message like '%fiscal%' (sorry is closed on test not is the problem)

but if use


SELECT * FROM "errors_prima*"

where message like '%(No message present%

have results

if use with no filter have meny record and exist a string
`Author fiscal

code can't be empty`

SELECT * FROM "errors_prima*"

@timestamp @version host message path
2022-09-30T19:22:14+02:00 1 8d2871a9f264 2022-09-22 14:48:30,538 ERROR (<?xml version="1.0" encoding="UTF-8" standalone="yes"?><xds:response xmlns:xds="Open eHealth Foundation · GitHub">xds:statusFailure</xds:status>xds:errorxds:errorCodeLocalPolicyRestrictionError</xds:errorCode>xds:codeContextAuthor fiscal code can't be empty</xds:codeContext>xds:severityError</xds:severity></xds:error></xds:response>)
@timestamp @version host message path
2022-09-30T19:22:40+02:00 1 8d2871a9f264 2022-09-27 17:12:36,336 ERROR (TcpSocketConsumerRunnable[mllp://0.0.0.0:9010] - /192.168.0.7:56174 => /192.168.0.32:9010) Invalid MDM message (No message present) /logstash_dir/P1/server.log.2022-09-27

How are you submitting the SQL queries through which interface?

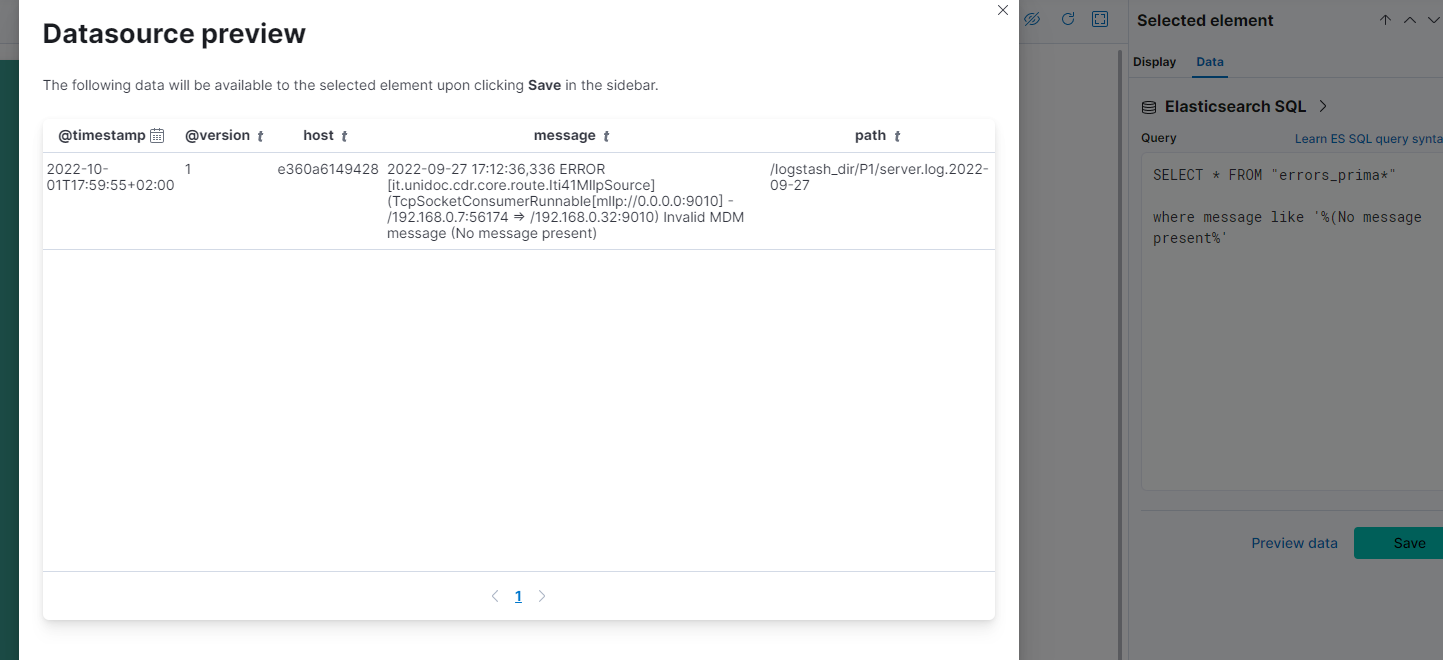
One thing I notice is that you do not have a closing '

where message like '%fiscal%
should be
where message like '%fiscal%'. <!---- Closing Single Quote

Perhaps try that....

You can test your Queries From Kibana Dev Tools

The look like this ... you have to do some Escaping

POST _sql?format=txt
{
  "query":"SELECT \"@timestamp\", service.name, cloudfoundry.app.name as app FROM \"filebeat-*\" WHERE app LIKE '%data%' LIMIT 10"
}
       @timestamp       | service.name  |         app         
------------------------+---------------+---------------------
2022-09-25T08:55:07.422Z|cardatabase    |cardatabase-back-end 
2022-09-27T09:17:39.745Z|cardatabase    |cardatabase-back-end 
2022-09-29T09:35:37.762Z|null           |cardatabase-back-end 
2022-09-30T09:47:32.683Z|null           |cardatabase-back-end 
2022-09-09T06:17:47.998Z|null           |cardatabase-front-end
2022-09-10T06:27:50.242Z|cardatabase    |cardatabase-back-end 
2022-09-14T07:07:49.476Z|cardatabase    |cardatabase-back-end 
2022-09-18T07:47:51.706Z|cardatabase    |cardatabase-back-end 
2022-09-19T07:57:50.910Z|cardatabase    |cardatabase-back-end 
2022-09-21T08:17:34.757Z|cardatabase    |cardatabase-back-end 

yes i close the quote in original test error is in post this is my dashboard image

very mistake same index have other string inner

if search all "fiscal" string exists

What Elastic version are you on?

BTW Leading %like are VERY inefficient and could negatively impact your cluster on large data sets

Can you try the same from Kibana -> Dev Tools see the results?

You are doing this from canvas correct? Yes I see.

And very important what is the type of message field

Stack Management -> Data Views ->

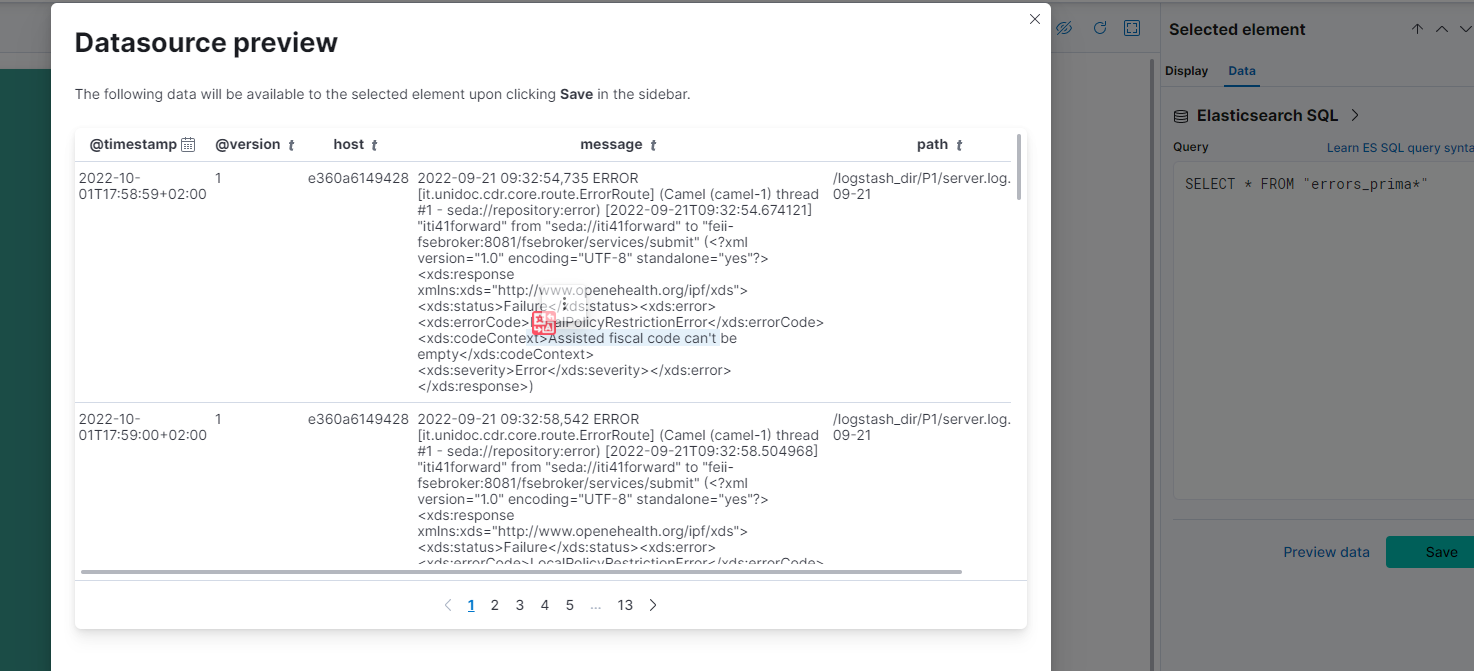
Not sure what is going on... I would make a quick data table... and check everything
the %value% will not work on a data type text will only work on a keyword

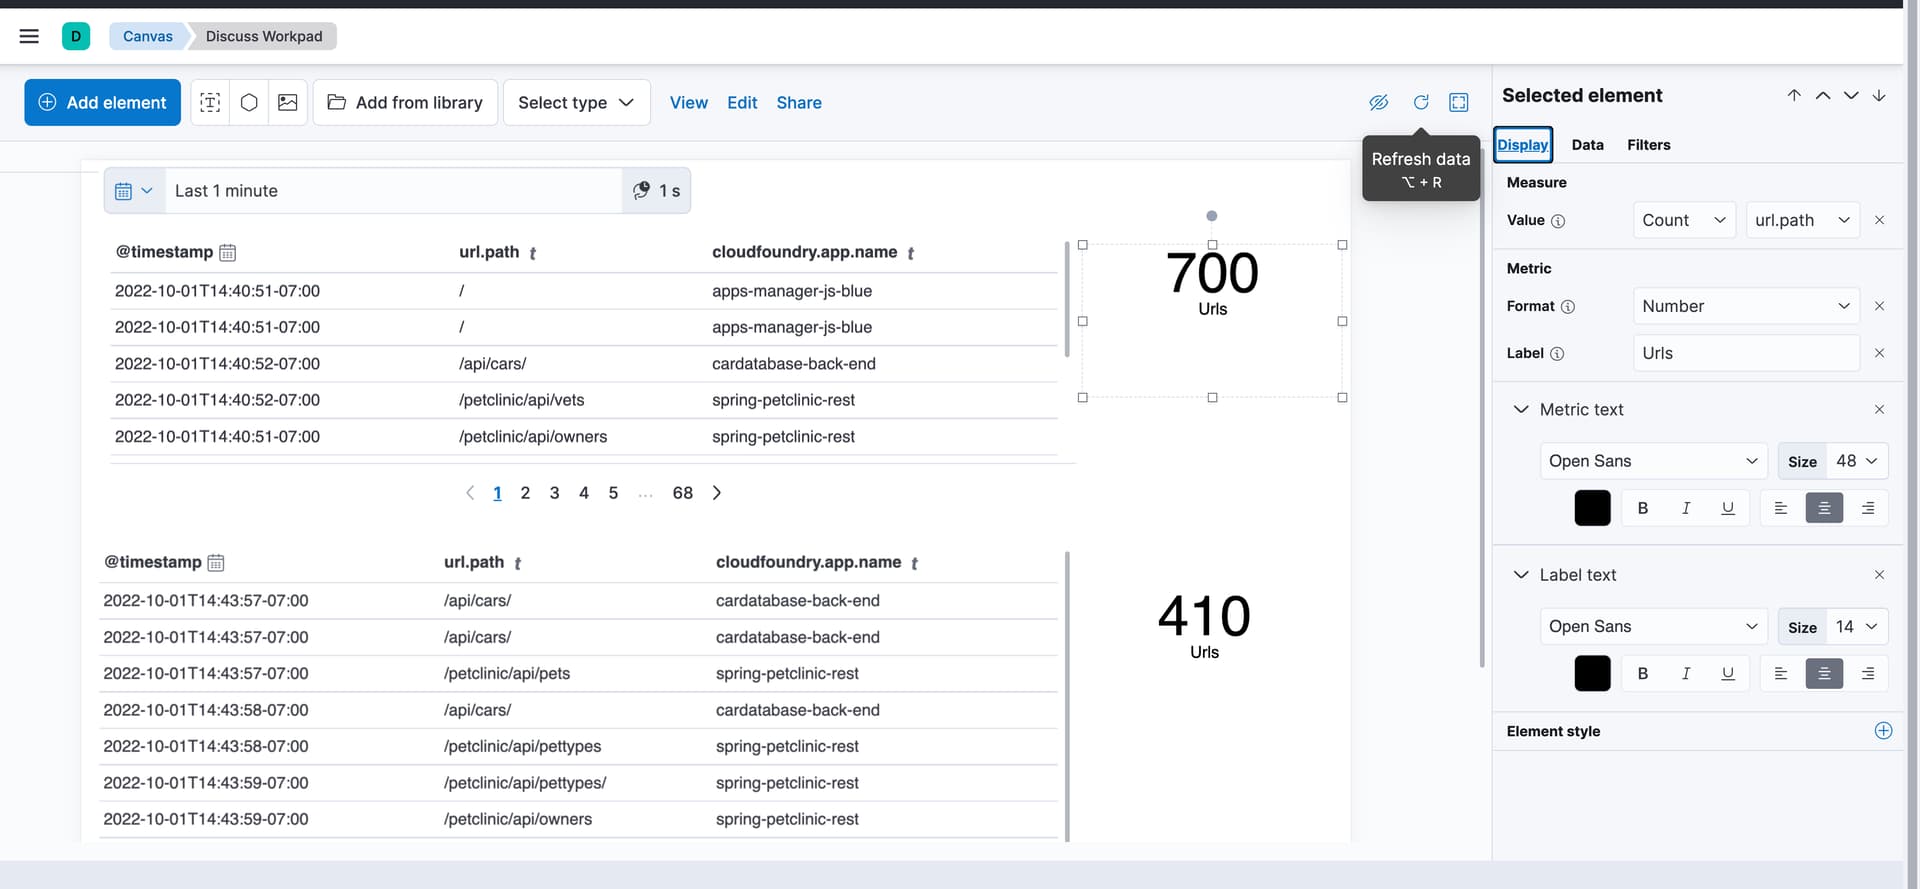
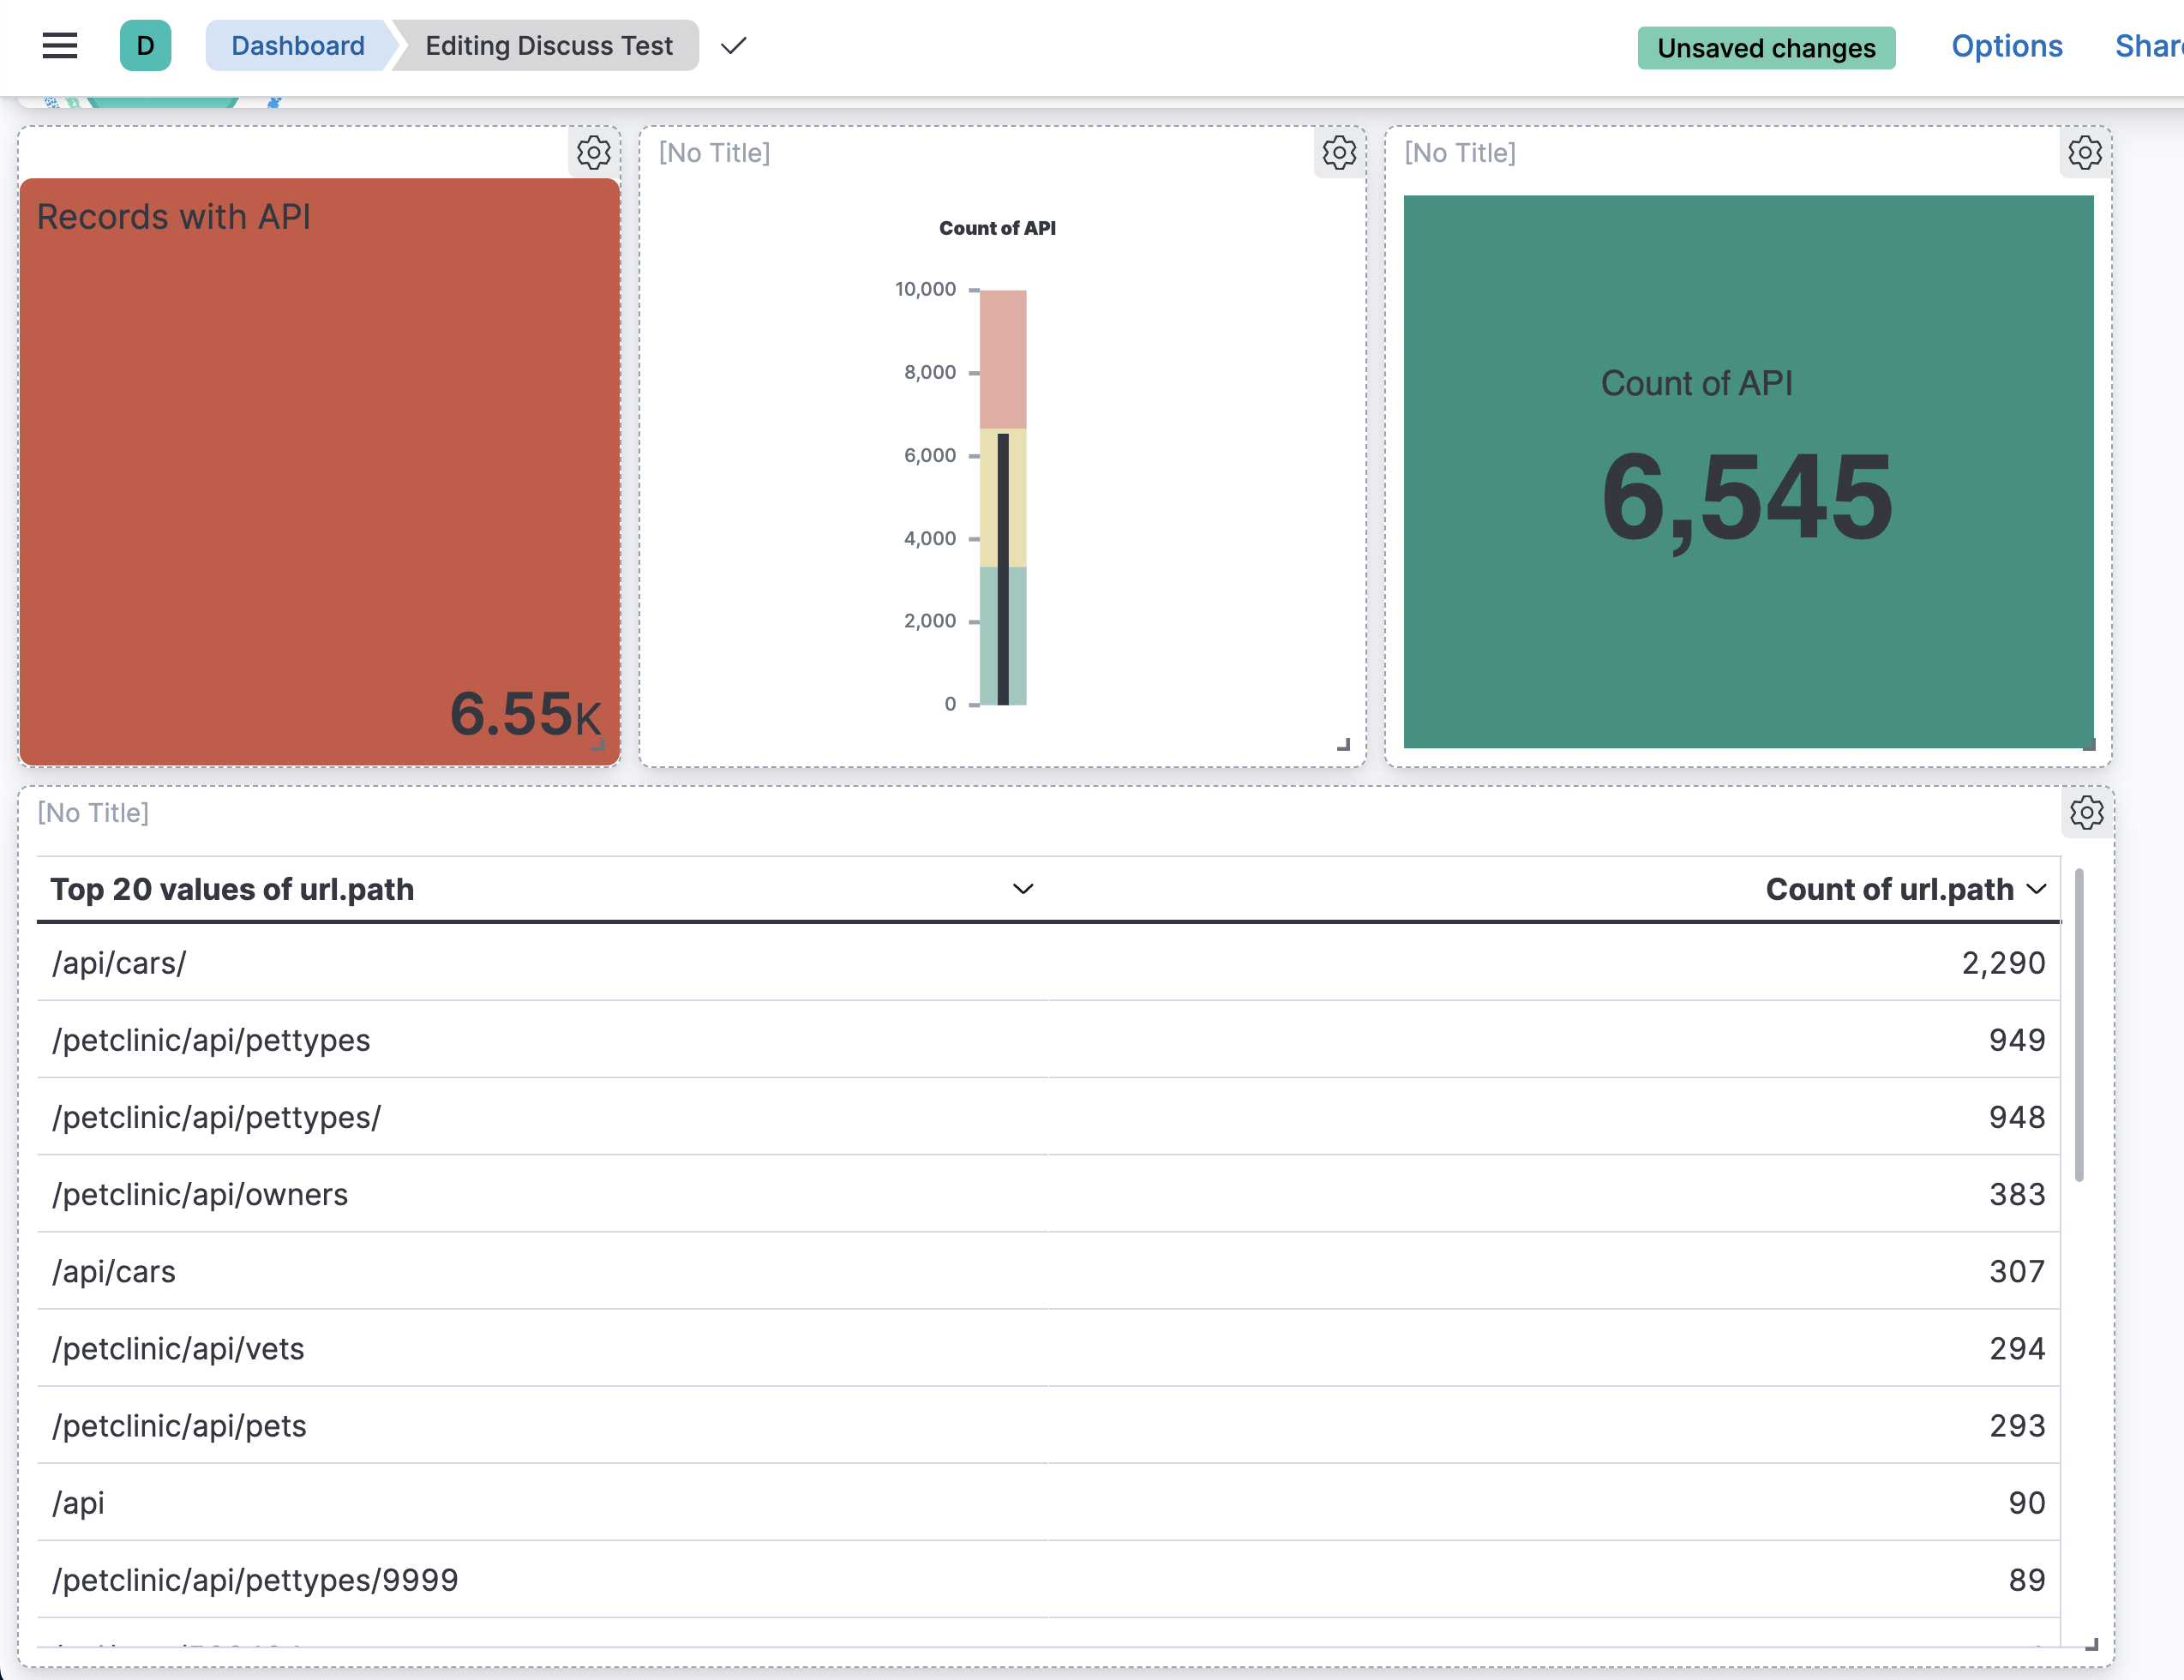
Top Table and Metric

SELECT "@timestamp", url.path, cloudfoundry.app.name  FROM ".ds-filebeat-8.2.3-2022.10.01-000304" WHERE cloudfoundry.app.name IS NOT NULL and url.path IS NOT NULL

Bottom Table and Metric

SELECT "@timestamp", url.path, cloudfoundry.app.name  FROM ".ds-filebeat-8.2.3-2022.10.01-000304" WHERE cloudfoundry.app.name IS NOT NULL and url.path LIKE '%api%'

I will admit Canvas is not my favorite Vis Tool...

You could probably build all this with a Dashboard and Lens in like 10 Mins... much easier..

Using KQL much easier... fast / efficient.

Each of these took me 30 sec each


Unless you are really looking to some special canvas work I would use Regular Dashboards and Lens

3 of them on a dashboard plus the Table less than 5 mins BUT *token* just like the like is very inefficient just keep that in mind..

hello i use version 7.16.2 basic

this is stack management

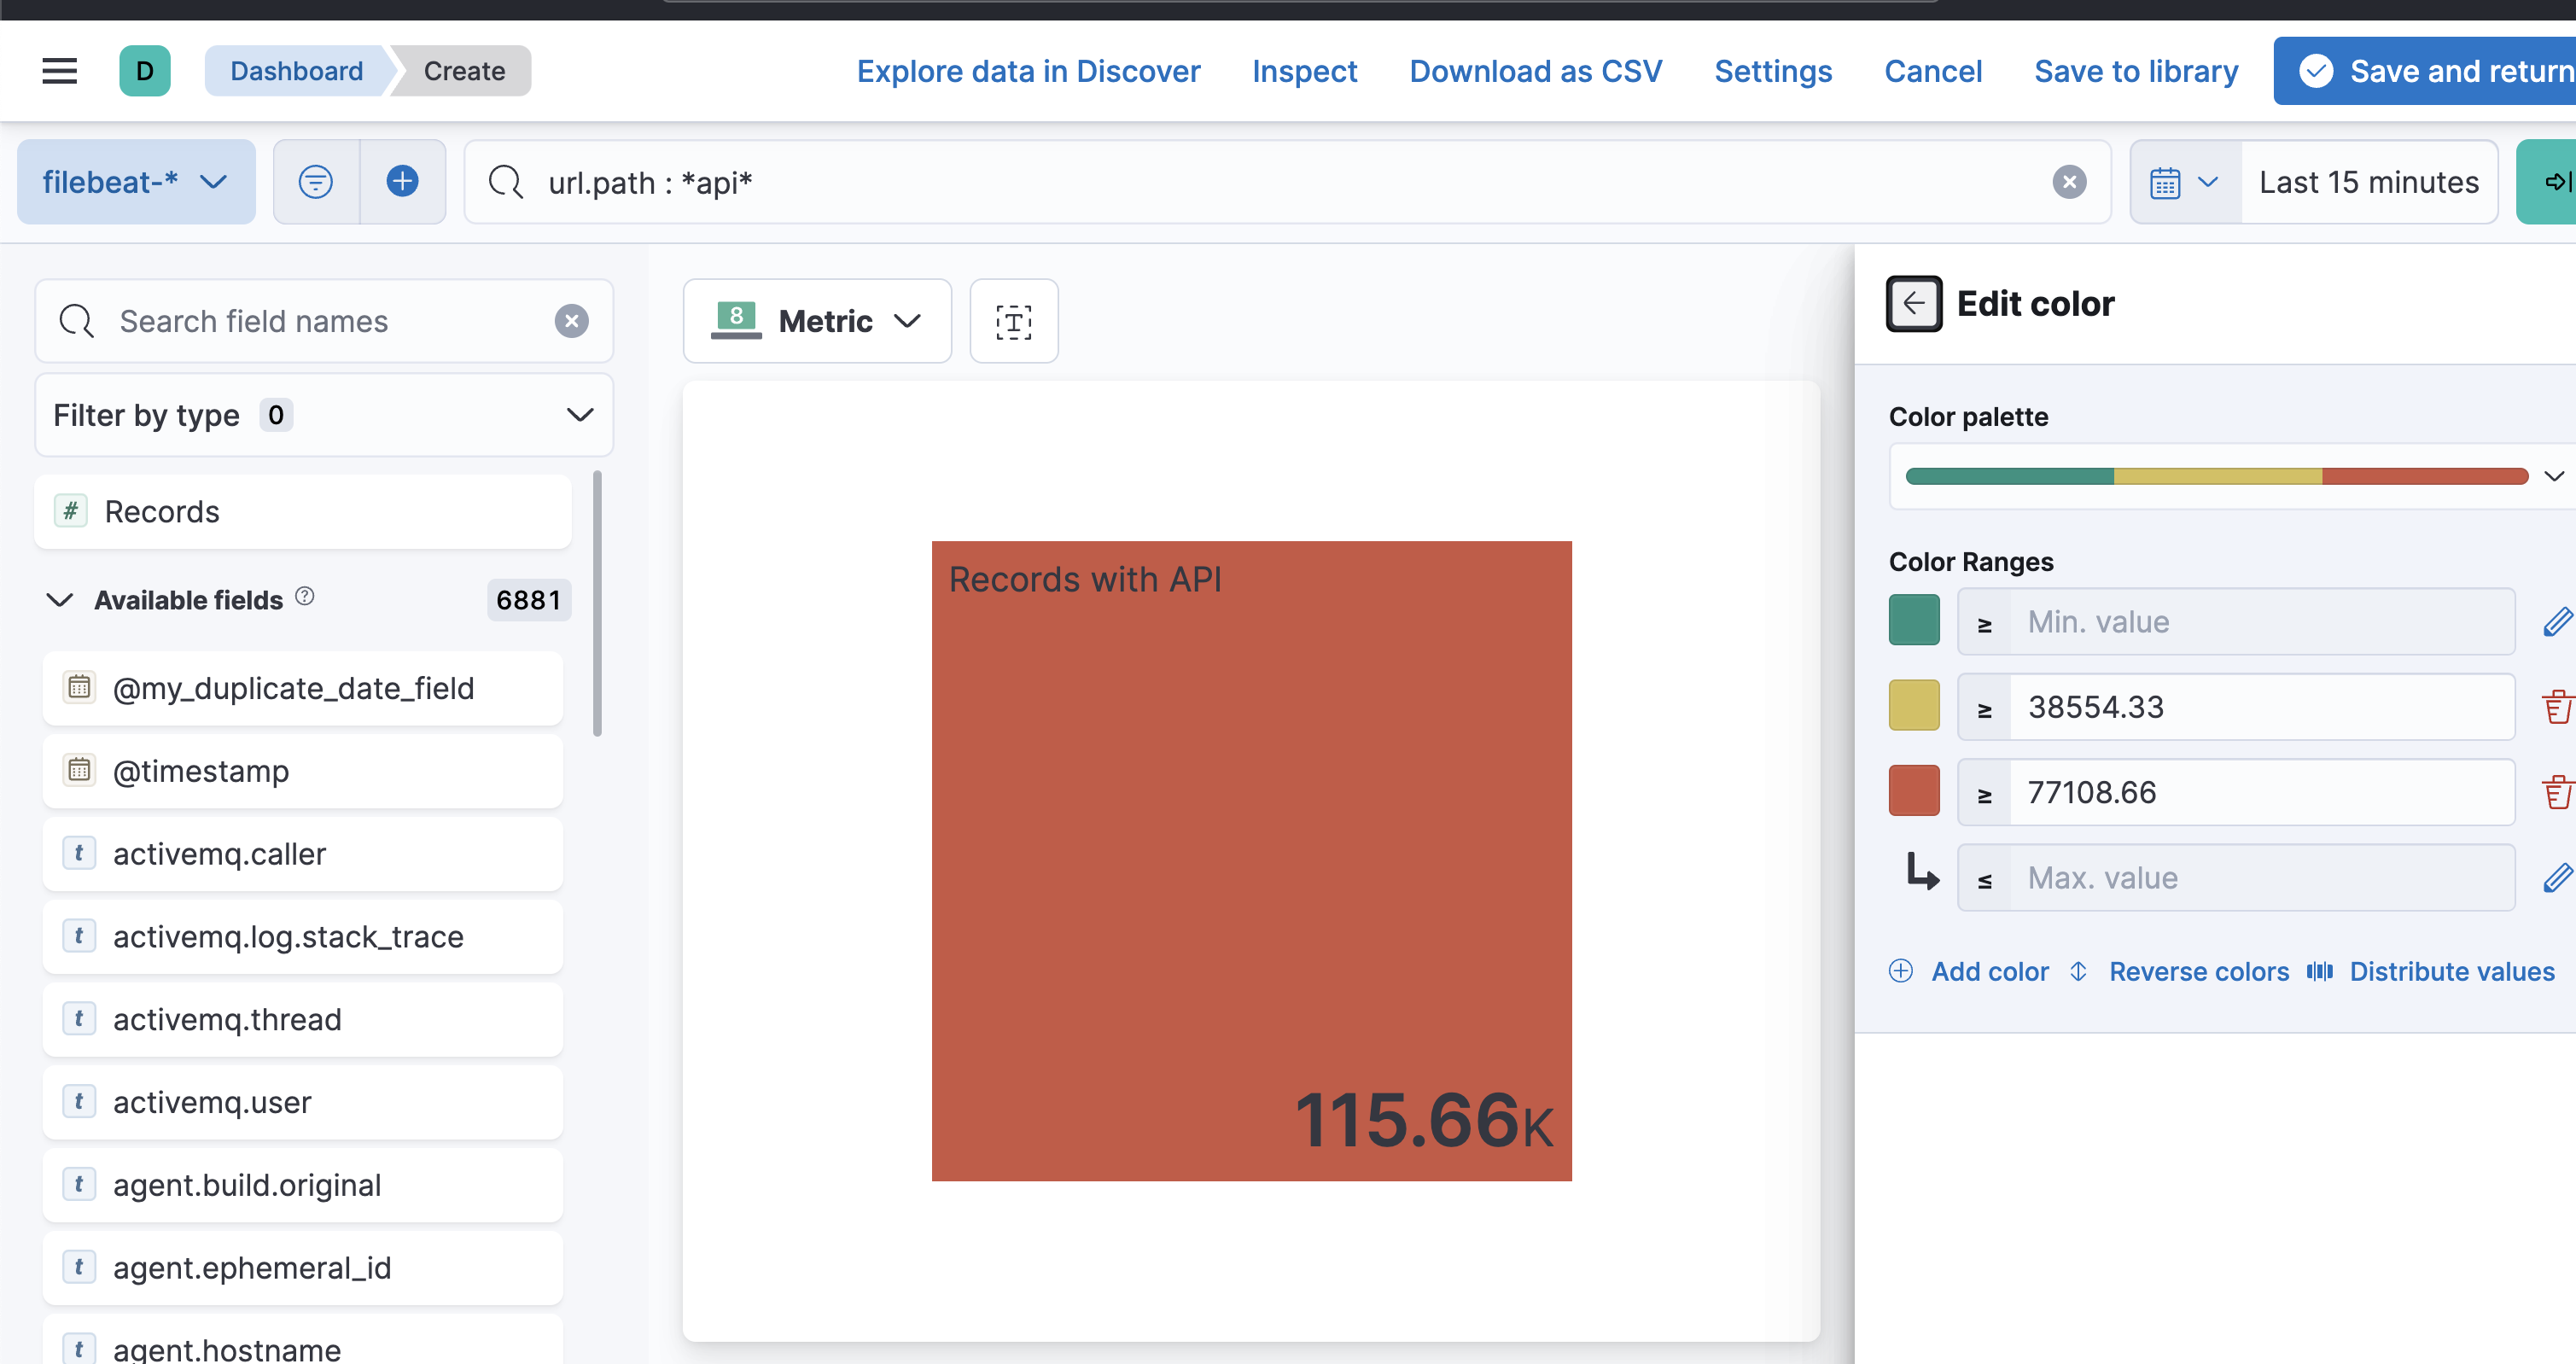
Ok ... Everything I stated above should be pretty valid.
There may not be the brand new metrics widget in lens.
I will go back you could create this in Lens without all the SQL.
I did get SQL to work in Canvas but it appears to be a bit "finicky"

i' ve used docker-compose version logstash+elastic++kibana i dont see a filebeat but the file is indexed

but I see strange things in the query

Yes as I said Canvas + SQL seem to have a few issues and is hard to use (just my opinion especially for a simple dashboard) ... BUT I did get it to work... it is very picky / sensitive ... changing too fast can cause issues... syntax errors, large data set .. etc... wildcards etc.

My Suggestion :slight_smile:

A regular Dashboard + Lens + KQL will get you there much faster / easier... MUCH faster / easier

Just my Suggestion

if you want help on filebeat please open a separate topic.

hello do you have a docker-compose specific version to advise me,
that has been tested well?

See Start a multi-node cluster with Docker Compose

I run this all the time...

I still think perhaps you may be more successful with Normal Dashboards + Lens instead of Canvas + SQL it is just my experience / suggestion.

hello i've create the docker-compose with cluster by at the end of create receive the error


ERROR: for kibana  Container "06c680e075d8" is unhealthy.
ERROR: Encountered errors while bringing up the project.

Please open a separate thread for the docker question, please include your entire docker compose we can not help with just the error message.

ok tnx

1 Like

This topic was automatically closed 28 days after the last reply. New replies are no longer allowed.