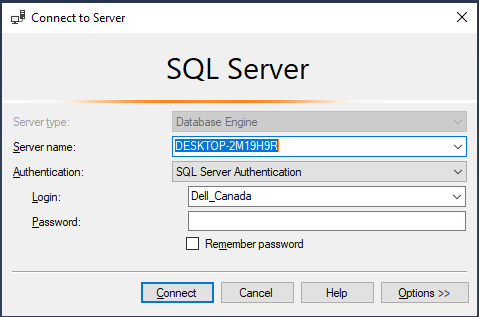
Yes i am using the Sql Server Management Studio.
Since it's a local for Practice purpose
Yes i am using the Sql Server Management Studio.
Since it's a local for Practice purpose
Try this.
jdbc_connection_string => "jdbc:sqlserver://localhost:1433;databaseName=XXX;integratedSecurity=false;"
Where XXX is replace with the databaseName you want to connect to.
but this time different error.
C:\elastic_stack\logstash-7.8.1\config>logstash -f C:\elastic_stack\logstash-7.8.1\config\sql.conf
Sending Logstash logs to C:/elastic_stack/logstash-7.8.1/logs which is now configured via log4j2.properties
[2020-08-19T14:12:57,421][WARN ][logstash.config.source.multilocal] Ignoring the 'pipelines.yml' file because modules or command line options are specified
[2020-08-19T14:12:57,565][INFO ][logstash.runner ] Starting Logstash {"logstash.version"=>"7.8.1", "jruby.version"=>"jruby 9.2.11.1 (2.5.7) 2020-03-25 b1f55b1a40 Java HotSpot(TM) 64-Bit Server VM 25.261-b12 on 1.8.0_261-b12 +indy +jit [mswin32-x86_64]"}
[2020-08-19T14:13:00,363][INFO ][org.reflections.Reflections] Reflections took 76 ms to scan 1 urls, producing 21 keys and 41 values
[2020-08-19T14:13:01,769][INFO ][logstash.outputs.elasticsearch][main] Elasticsearch pool URLs updated {:changes=>{:removed=>, :added=>[http://localhost:9200/]}}
[2020-08-19T14:13:02,276][WARN ][logstash.outputs.elasticsearch][main] Restored connection to ES instance {:url=>"http://localhost:9200/"}
[2020-08-19T14:13:02,397][INFO ][logstash.outputs.elasticsearch][main] ES Output version determined {:es_version=>7}
[2020-08-19T14:13:02,405][WARN ][logstash.outputs.elasticsearch][main] Detected a 6.x and above cluster: the type event field won't be used to determine the document _type {:es_version=>7}
[2020-08-19T14:13:02,529][INFO ][logstash.outputs.elasticsearch][main] New Elasticsearch output {:class=>"LogStash::Outputs::ElasticSearch", :hosts=>["//localhost:9200"]}
[2020-08-19T14:13:02,644][INFO ][logstash.outputs.elasticsearch][main] Using default mapping template
[2020-08-19T14:13:02,777][INFO ][logstash.javapipeline ][main] Starting pipeline {:pipeline_id=>"main", "pipeline.workers"=>8, "pipeline.batch.size"=>125, "pipeline.batch.delay"=>50, "pipeline.max_inflight"=>1000, "pipeline.sources"=>["C:/elastic_stack/logstash-7.8.1/config/sql.conf"], :thread=>"#<Thread:0x77f560cf run>"}
[2020-08-19T14:13:02,799][INFO ][logstash.outputs.elasticsearch][main] Attempting to install template {:manage_template=>{"index_patterns"=>"logstash-", "version"=>60001, "settings"=>{"index.refresh_interval"=>"5s", "number_of_shards"=>1}, "mappings"=>{"dynamic_templates"=>[{"message_field"=>{"path_match"=>"message", "match_mapping_type"=>"string", "mapping"=>{"type"=>"text", "norms"=>false}}}, {"string_fields"=>{"match"=>"", "match_mapping_type"=>"string", "mapping"=>{"type"=>"text", "norms"=>false, "fields"=>{"keyword"=>{"type"=>"keyword", "ignore_above"=>256}}}}}], "properties"=>{"@timestamp"=>{"type"=>"date"}, "@version"=>{"type"=>"keyword"}, "geoip"=>{"dynamic"=>true, "properties"=>{"ip"=>{"type"=>"ip"}, "location"=>{"type"=>"geo_point"}, "latitude"=>{"type"=>"half_float"}, "longitude"=>{"type"=>"half_float"}}}}}}}
[2020-08-19T14:13:05,107][INFO ][logstash.javapipeline ][main] Pipeline started {"pipeline.id"=>"main"}
[2020-08-19T14:13:05,203][INFO ][logstash.agent ] Pipelines running {:count=>1, :running_pipelines=>[:main], :non_running_pipelines=>}
[2020-08-19T14:13:05,965][INFO ][logstash.agent ] Successfully started Logstash API endpoint {:port=>9600}
[2020-08-19T14:13:07,174][INFO ][logstash.inputs.jdbc ][main][a1bff951cc9088ff0ffbcc9f39611da047548f0e7d3be04688549356ff34a290] (0.061888s) SELECT * FROM dbo.student
[2020-08-19T14:13:08,908][INFO ][logstash.runner ] Logstash shut down.
That shows the query that was ran. Is that correct? If you execute SELECT * FROM dbo.student query in SQL Server Management Studio does it give you the results you want?
Yes, this query ran successful in SQL Server.
SELECT * FROM dbo.student
But i how i can check in Kibana?
I was in perplexing situation, whether it's working working or not but after i look at this log still i feel like something throw an error.
This log captured from this path (C:\elastic_stack\logstash-7.8.1\logs)
[2020-08-19T10:47:36,881][ERROR][logstash.agent ] An exception happened when converging configuration {:exception=>LogStash::Error, :message=>"Don't know how to handle Java::JavaLang::IllegalStateException for PipelineAction::Create<main>"}
[2020-08-19T10:47:36,923][FATAL][logstash.runner ] An unexpected error occurred! {:error=>#<LogStash::Error: Don't know how to handle Java::JavaLang::IllegalStateException for PipelineAction::Create<main>>, :backtrace=>["org/logstash/execution/ConvergeResultExt.java:129:in create'", "org/logstash/execution/ConvergeResultExt.java:57:in add'", "C:/elastic_stack/logstash-7.8.1/logstash-core/lib/logstash/agent.rb:369:in `block in converge_state'"]}
[2020-08-19T10:47:36,942][ERROR][org.logstash.Logstash ] java.lang.IllegalStateException: Logstash stopped processing because of an error: (SystemExit) exit
[2020-08-19T10:54:31,186][WARN ][logstash.config.source.multilocal] Ignoring the 'pipelines.yml' file because modules or command line options are specified
[2020-08-19T10:54:31,300][INFO ][logstash.runner ] Starting Logstash {"logstash.version"=>"7.8.1", "jruby.version"=>"jruby 9.2.11.1 (2.5.7) 2020-03-25 b1f55b1a40 Java HotSpot(TM) 64-Bit Server VM 25.261-b12 on 1.8.0_261-b12 +indy +jit [mswin32-x86_64]"}
[2020-08-19T10:54:31,857][INFO ][logstash.config.source.local.configpathloader] No config files found in path {:path=>"C:/elastic_stack/logstash-7.8.1/config/config/sql.conf"}
[2020-08-19T10:54:31,873][ERROR][logstash.config.sourceloader] No configuration found in the configured sources.
[2020-08-19T10:54:32,410][INFO ][logstash.agent ] Successfully started Logstash API endpoint {:port=>9600}
[2020-08-19T10:54:37,356][INFO ][logstash.runner ] Logstash shut down.
This log captured from cmd prompt
[2020-08-19T14:43:44,396][INFO ][logstash.outputs.elasticsearch][main] Using default mapping template
[2020-08-19T14:43:44,525][INFO ][logstash.javapipeline ][main] Starting pipeline {:pipeline_id=>"main", "pipeline.workers"=>8, "pipeline.batch.size"=>125, "pipeline.batch.delay"=>50, "pipeline.max_inflight"=>1000, "pipeline.sources"=>["C:/elastic_stack/logstash-7.8.1/config/sql.conf"], :thread=>"#<Thread:0x451b6f52 run>"}
[2020-08-19T14:43:44,606][INFO ][logstash.outputs.elasticsearch][main] Attempting to install template {:manage_template=>{"index_patterns"=>"logstash-", "version"=>60001, "settings"=>{"index.refresh_interval"=>"5s", "number_of_shards"=>1}, "mappings"=>{"dynamic_templates"=>[{"message_field"=>{"path_match"=>"message", "match_mapping_type"=>"string", "mapping"=>{"type"=>"text", "norms"=>false}}}, {"string_fields"=>{"match"=>"", "match_mapping_type"=>"string", "mapping"=>{"type"=>"text", "norms"=>false, "fields"=>{"keyword"=>{"type"=>"keyword", "ignore_above"=>256}}}}}], "properties"=>{"@timestamp"=>{"type"=>"date"}, "@version"=>{"type"=>"keyword"}, "geoip"=>{"dynamic"=>true, "properties"=>{"ip"=>{"type"=>"ip"}, "location"=>{"type"=>"geo_point"}, "latitude"=>{"type"=>"half_float"}, "longitude"=>{"type"=>"half_float"}}}}}}}
[2020-08-19T14:43:46,839][INFO ][logstash.javapipeline ][main] Pipeline started {"pipeline.id"=>"main"}
[2020-08-19T14:43:46,966][INFO ][logstash.agent ] Pipelines running {:count=>1, :running_pipelines=>[:main], :non_running_pipelines=>}
[2020-08-19T14:43:47,762][INFO ][logstash.agent ] Successfully started Logstash API endpoint {:port=>9600}
[2020-08-19T14:43:49,241][INFO ][logstash.inputs.jdbc ][main][994ffd240ad7023dd673bf75a2e452a9ef799ec9e06385374898c744872d1f5f] (0.099373s) SELECT count(*) FROM dbo.student
[2020-08-19T14:43:50,695][INFO ][logstash.runner ] Logstash shut down.
Change your output to
output {
  stdout  { }
}
and let me know what happens.
Yeah aaron, now i got this.
C:\elastic_stack\logstash-7.8.1\config>logstash -f sql.conf
Sending Logstash logs to C:/elastic_stack/logstash-7.8.1/logs which is now configured via log4j2.properties
[2020-08-19T17:19:07,632][WARN ][logstash.config.source.multilocal] Ignoring the 'pipelines.yml' file because modules or command line options are specified
[2020-08-19T17:19:07,780][INFO ][logstash.runner ] Starting Logstash {"logstash.version"=>"7.8.1", "jruby.version"=>"jruby 9.2.11.1 (2.5.7) 2020-03-25 b1f55b1a40 Java HotSpot(TM) 64-Bit Server VM 25.261-b12 on 1.8.0_261-b12 +indy +jit [mswin32-x86_64]"}
[2020-08-19T17:19:10,506][INFO ][org.reflections.Reflections] Reflections took 74 ms to scan 1 urls, producing 21 keys and 41 values
[2020-08-19T17:19:12,655][INFO ][logstash.javapipeline ][main] Starting pipeline {:pipeline_id=>"main", "pipeline.workers"=>8, "pipeline.batch.size"=>125, "pipeline.batch.delay"=>50, "pipeline.max_inflight"=>1000, "pipeline.sources"=>["C:/elastic_stack/logstash-7.8.1/config/sql.conf"], :thread=>"#<Thread:0x63613118 run>"}
[2020-08-19T17:19:14,352][INFO ][logstash.javapipeline ][main] Pipeline started {"pipeline.id"=>"main"}
[2020-08-19T17:19:14,474][INFO ][logstash.agent ] Pipelines running {:count=>1, :running_pipelines=>[:main], :non_running_pipelines=>}
[2020-08-19T17:19:15,005][INFO ][logstash.agent ] Successfully started Logstash API endpoint {:port=>9600}
[2020-08-19T17:19:16,723][INFO ][logstash.inputs.jdbc ][main][5d9f5da7c24582386ded8e5430bcbe6da80eaa9e65af4d3e74428f1e7f3bd9c3] (0.148252s) SELECT count(*) FROM dbo.student
C:/elastic_stack/logstash-7.8.1/vendor/bundle/jruby/2.5.0/gems/awesome_print-1.7.0/lib/awesome_print/formatters/base_formatter.rb:31: warning: constant ::Fixnum is deprecated
{
"untitled" => 5,
"@version" => "1",
"@timestamp" => 2020-08-19T21:19:16.833Z
}
[2020-08-19T17:19:17,805][INFO ][logstash.runner ] Logstash shut down.
C:\elastic_stack\logstash-7.8.1\config>
Hi aaron,
Good Morning,
Now index created on kibana finally.
Thanks for your time on this.
Great @sukumar.koganti. Glad it is working now! 
Yes Thank you so much..
Well appreciated and Looking forward to discuss more.
© 2020. All Rights Reserved - Elasticsearch
Apache, Apache Lucene, Apache Hadoop, Hadoop, HDFS and the yellow elephant logo are trademarks of the Apache Software Foundation in the United States and/or other countries.