I am using ELK 6.4.0 and Beat (Filebeat, Metricbeat). My architecture is Filebeat->Logstash->Elasticsearch->Kibana.
I am sending my auth.log using filebeat but i am not using filebeat system module. Because Filebeat system module can't use directly with logstash. So i am using logstash pipeline. My Grok filter for auth.log is looks like below:
grok {
match => { "message" => ["%{SYSLOGTIMESTAMP:[system][auth][timestamp]} %{SYSLOGHOST:[system][auth][hostname]} sshd(?:\[%{POSINT:[system][auth][pid]}\])?: %{DATA:[system][auth][ssh][event]} %{DATA:[system][auth][ssh][method]} for (invalid user )?%{DATA:[system][auth][user]} from %{IPORHOST:[system][auth][ssh][ip]} port %{NUMBER:[system][auth][ssh][port]} ssh2(: %{GREEDYDATA:[system][auth][ssh][signature]})?", "%{SYSLOGTIMESTAMP:[system][auth][timestamp]} %{SYSLOGHOST:[system][auth][hostname]} sshd(?:\[%{POSINT:[system][auth][pid]}\])?: %{DATA:[system][auth][ssh][event]} user %{DATA:[system][auth][user]} from %{IPORHOST:[system][auth][ssh][ip]}", "%{SYSLOGTIMESTAMP:[system][auth][timestamp]} %{SYSLOGHOST:[system][auth][hostname]} sshd(?:\[%{POSINT:[system][auth][pid]}\])?: Did not receive identification string from %{IPORHOST:[system][auth][ssh][dropped_ip]}", "%{SYSLOGTIMESTAMP:[system][auth][timestamp]} %{SYSLOGHOST:[system][auth][hostname]} sudo(?:\[%{POSINT:[system][auth][pid]}\])?: \s*%{DATA:[system][auth][user]} :( %{DATA:[system][auth][sudo][error]} ;)? TTY=%{DATA:[system][auth][sudo][tty]} ; PWD=%{DATA:[system][auth][sudo][pwd]} ; USER=%{DATA:[system][auth][sudo][user]} ; COMMAND=%{GREEDYDATA:[system][auth][sudo][command]}", "%{SYSLOGTIMESTAMP:[system][auth][timestamp]} %{SYSLOGHOST:[system][auth][hostname]} groupadd(?:\[%{POSINT:[system][auth][pid]}\])?: new group: name=%{DATA:system.auth.groupadd.name}, GID=%{NUMBER:system.auth.groupadd.gid}", "%{SYSLOGTIMESTAMP:[system][auth][timestamp]} %{SYSLOGHOST:[system][auth][hostname]} useradd(?:\[%{POSINT:[system][auth][pid]}\])?: new user: name=%{DATA:[system][auth][user][add][name]}, UID=%{NUMBER:[system][auth][user][add][uid]}, GID=%{NUMBER:[system][auth][user][add][gid]}, home=%{DATA:[system][auth][user][add][home]}, shell=%{DATA:[system][auth][user][add][shell]}$", "%{SYSLOGTIMESTAMP:[system][auth][timestamp]} %{SYSLOGHOST:[system][auth][hostname]} %{DATA:[system][auth][program]}(?:\[%{POSINT:[system][auth][pid]}\])?: %{GREEDYMULTILINE:[system][auth][message]}"] }
pattern_definitions => {
        "GREEDYMULTILINE"=> "(.|\n)*"
      }
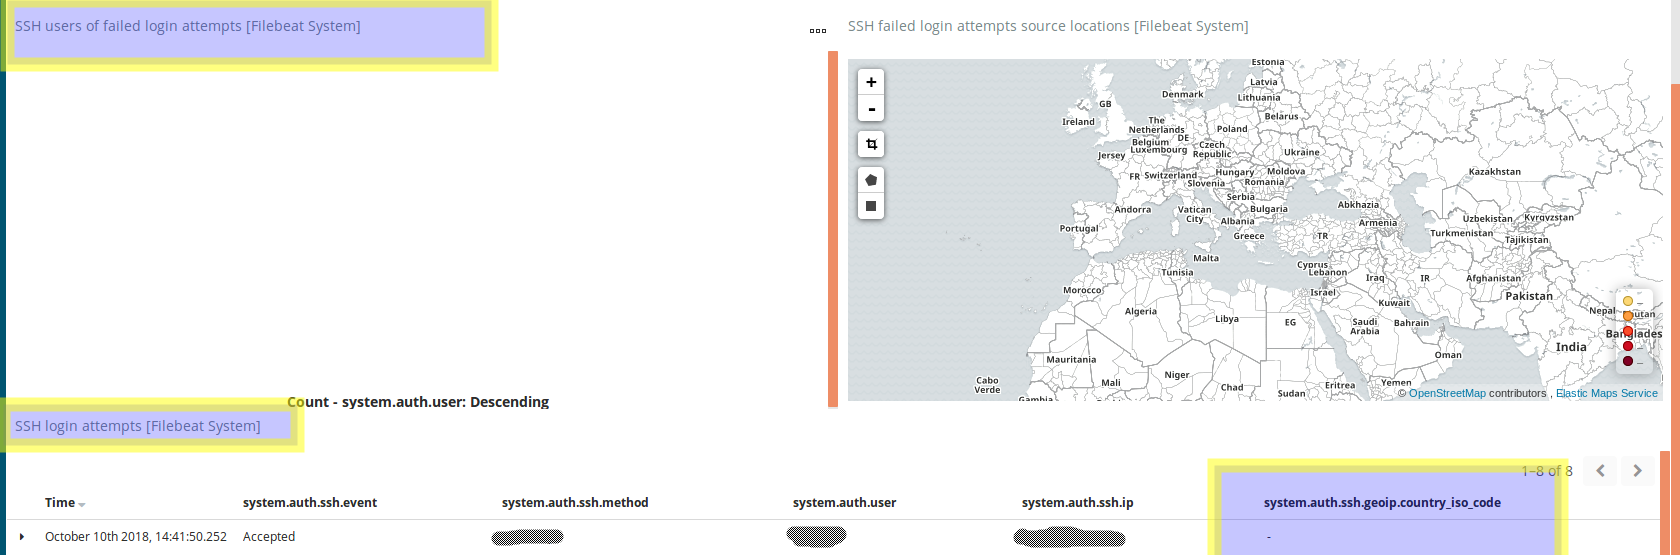
The auth.log are reaching on kibana dashboard. But when i am checking the Filebeat dashbaord for SSH login attempts i am not seeing any value for filed system.auth.ssh.geoip.country_iso_code. Please refer the below screenshot:
Can we replace the field system.auth.ssh.geoip.country_iso_code with system.auth.ssh.geoip.country_code2 from visualize in kibana? I have checked but didn't found any such option or can we add any field in grok filter for Auth log?
I want to trace the country name also from where we are tried to SSH our servers.
Please help me to fix the issue. Any assistance will be appreciated.
But i have one question for you, Can we replace the field system.auth.ssh.geoip.country_iso_code with system.auth.ssh.geoip.country_code2 in Visualize of SSH Login attempts?
I have tried to replace the field system.auth.ssh.geoip.country_iso_code with system.auth.ssh.geoip.country_code2 in Visualize of SSH Login attempts. But didn't found any such option. Can you please let me know where i can find this filed and replace?
I have tried to add sub-bucket but that also didn't work.
You need to look in the saved searches, in the Discover tab, at the SSH login attempts saved object. Then you find the field in the left list of fields, remove the system.auth.ssh.geoip.contry_iso_code field with system.auth.ssh.geoip.country_code2.
@Marius, I have made the changes as suggested by you i.e remove that filed and added new fields as per our requirements and saved the search.
Please refer the below screenshot:
But still when i am checking the Filebeat dashboard for SSH Login Attemptsunder Dashboard tab its showing old fields and not updated with the new fields.
I have restarted the Kibana service as well after making the changes.
Please refer the below screenshot:
Did you save the search without having checked the Save as new search checkbox after you changed the column? There is no need to restart the Kibana service for any changes to the saved objects.
And the dashboard still didn't update with the new value displayed in the column? If this is the case, you can try removing the saved search from the dashboard and adding it again.
Yes...dashboard is still not updated with new values displayed in the column.
Can you please tell me it step by step. Because i have deleted the [Filebeat System] SSH login attempts dashboard in my testing environment and added it again from the saved searches. Now dashboard is created but its not showing under Filebeat SSH login dashboard. Its breakdown.
I don't want break anything in my production environment.
Some please share the exact syntax for the ssh root attempts dashboard on kibana or in the json format. also I need to monitor the queue length of the logs
Sorry didn't get you. Can you please elaborate little bit more?
If you are using the filebeat then you have default Filebeat dashboard for SSH login attempts. You need to load the filebeat dashboard and its one time setup.
I have configured the filebeat in the client side side , but when I am trying to start the service I am getting below error
Oct 11 16:52:27 k8s-master systemd[1]: Unit filebeat.service entered failed state.
Oct 11 16:52:27 k8s-master systemd[1]: filebeat.service failed.
Oct 11 16:52:27 k8s-master systemd[1]: filebeat.service holdoff time over, scheduling restart.
Oct 11 16:52:27 k8s-master systemd[1]: start request repeated too quickly for filebeat.service
Oct 11 16:52:27 k8s-master systemd[1]: Failed to start Filebeat sends log files to Logstash or directly to Elasticsearch..
Oct 11 16:52:27 k8s-master systemd[1]: Unit filebeat.service entered failed state.
Oct 11 16:52:27 k8s-master systemd[1]: filebeat.service failed.
Apache, Apache Lucene, Apache Hadoop, Hadoop, HDFS and the yellow elephant
logo are trademarks of the
Apache Software Foundation
in the United States and/or other countries.