Status break Down Error in Kibana. Please help me to resolve this issues. Error screenshots attached.
.

It looks like you Elasticsearch cluster might be overwhelmed and in a red state. Look in the Elasticsearch logs for further clues about what exactly is wrong.
Thank you for your reply.
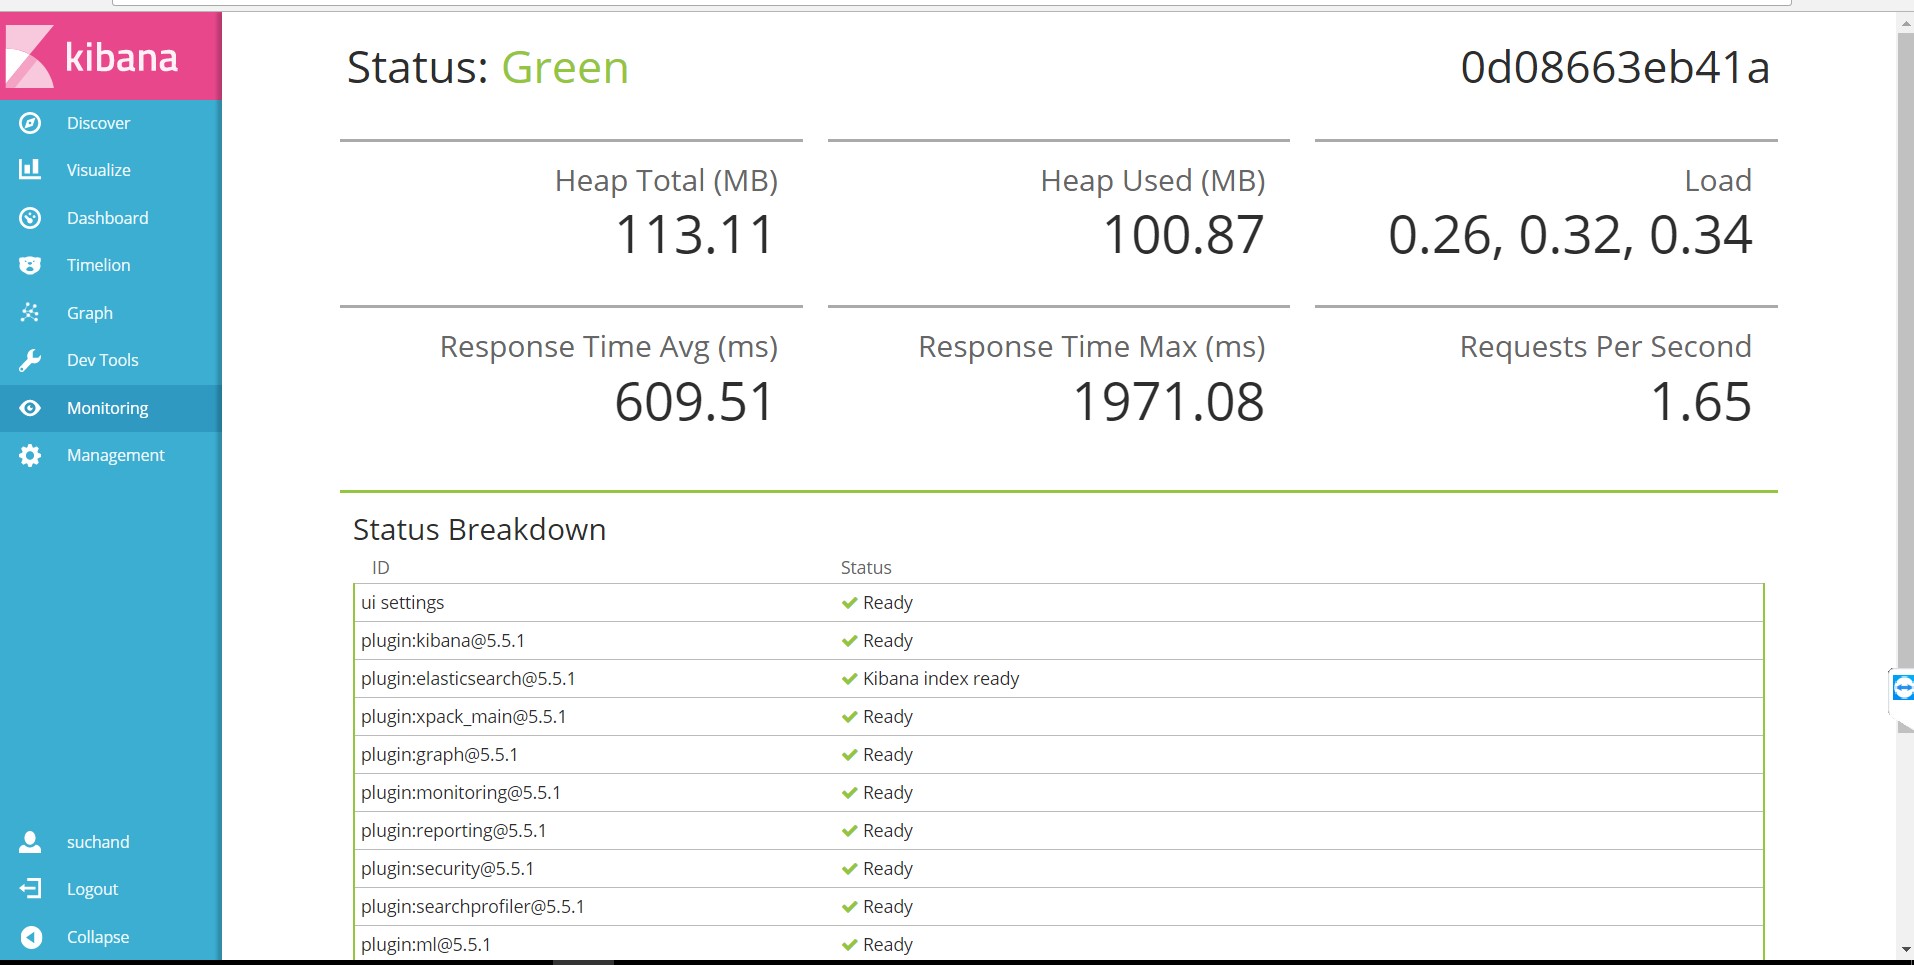
We have upgraded our cloud resource to solve this issue, but i am not able to resolve this issue yet. Sometime Kibana status showing Green status, but its not consistent. I have attached the Kibana status showing Green.
In addition to that i have attached Elasticsearch memory overview screenshot and a Fatal error screenshot.
Waiting for your kind feedback.


You have a very small instance and far too many shards. Each shard has overhead in terms of file handles and heap space. You will need to reduce the number of shards in the cluster dramatically and/or increase the size of the node. You can reduce the number of shards by using the shrink index API or simply reindex into indices with far fewer shards.
|Thank you for your reply.
I have gone through shrink index API link that you have provided. Still i am confused where should i add those script to shrink the index. Is it in elasticsearch.yml file?
I am using elk cloud instance.
It is a REST-based API, so you can access it though Console under Dev tools in Kibana.
Thank you for your support.
I am not able to reduce the number of Shards. But i have deleted all the replicas because here i have only a single node in my cluster. But still replica's generating automatically, how can i stop replicating shards.
You can control the number of replica shards through index templates.
thanks for your valuable reply.
Can you please help me to get a sample watcher to alert Brute Force Attack using windows Event id. (with throttling_period).
I need to show Source IP,Destination IP ,Computer name and User name in watcher history dashboard.
I have added this a separate topic in community, but not yet received a reply.
I do not have such a sample, but there are some other example watches available that you may be able to draw inspiration from.
Thanks for sharing that link.
Below i have shared the Watcher to alert Successful logon.
In this i would like to visualize the source IP and destination IP along with computer Name in dashboard. But now i am able to fetch only one single field(Computer name) . How can i fetch multiple field_Names in this. Also i the throatling_period which i have given in this script is not working.
{
"trigger": {
"schedule": {
"interval": "3m"
}
},
"input": {
"search": {
"request": {
"search_type": "query_then_fetch",
"indices": [
"*"
],
"types": [],
"body": {
"query": {
"bool": {
"filter": [
{
"range": {
"@timestamp": {
"from": "now-20h",
"to": "now"
}
}
},
{
"term": {
"event_id": "4624"
}
}
]
}
},
"aggs": {
"failed_name": {
"terms": {
"field": "computer_name"
}
}
}
}
}
}
},
"condition": {
"always": {}
},
"actions": {
"log_error": {
"logging": {
"level": "info",
"text": " Success Full Logon {{ctx.payload.aggregations.failed_name.buckets.0}}"
}
}
},
"throttle_period_in_millis": 120000
}
How come this unassigned Shard generates in Cluster. How can i avoid this. Can someone help me to do this.