The request is:
{
"size": 0,
"_source": {
"excludes": []
},
"aggs": {
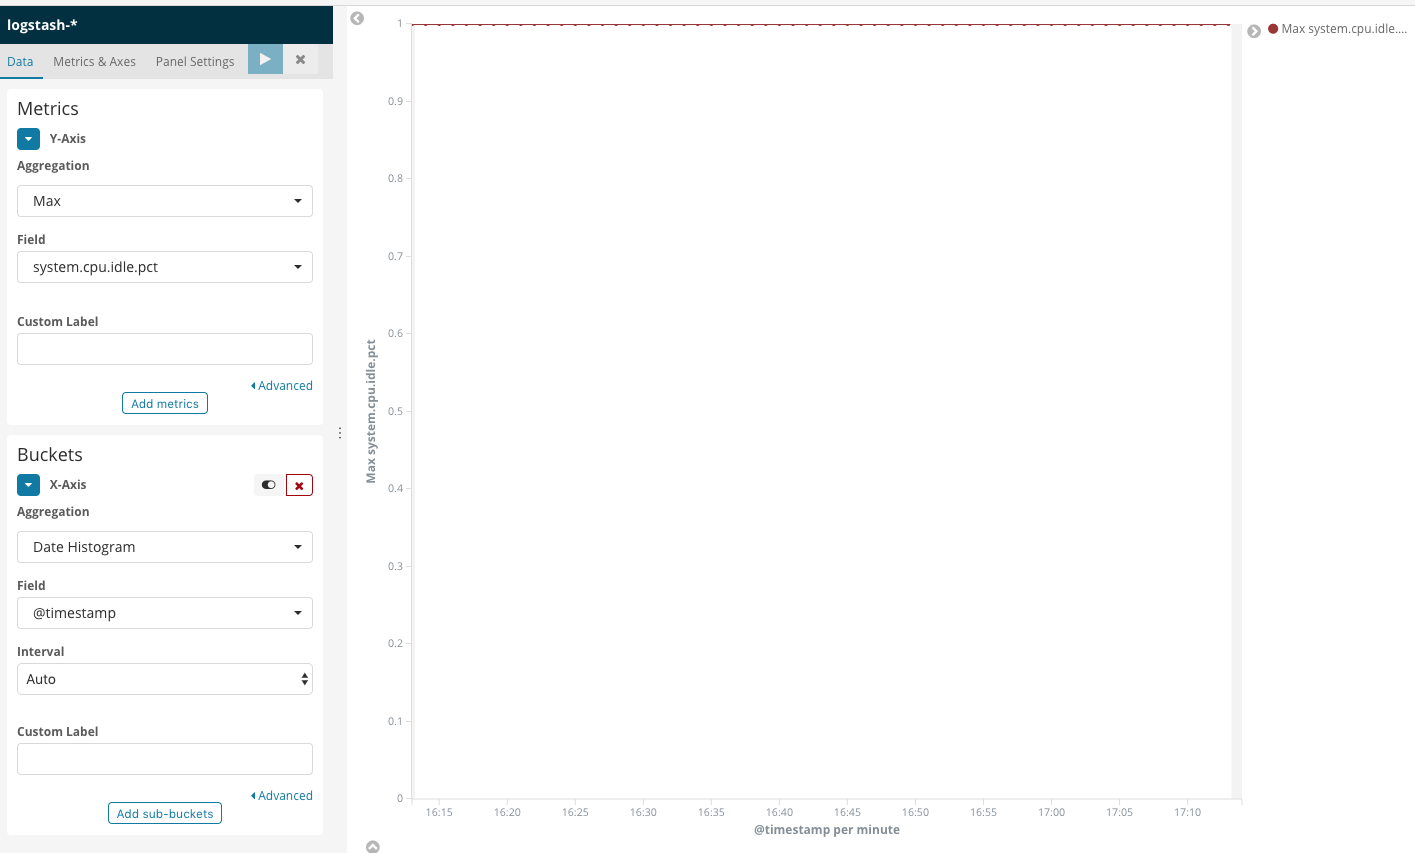
"2": {
"date_histogram": {
"field": "@timestamp",
"interval": "1m",
"time_zone": "Europe/London",
"min_doc_count": 1
},
"aggs": {
"1": {
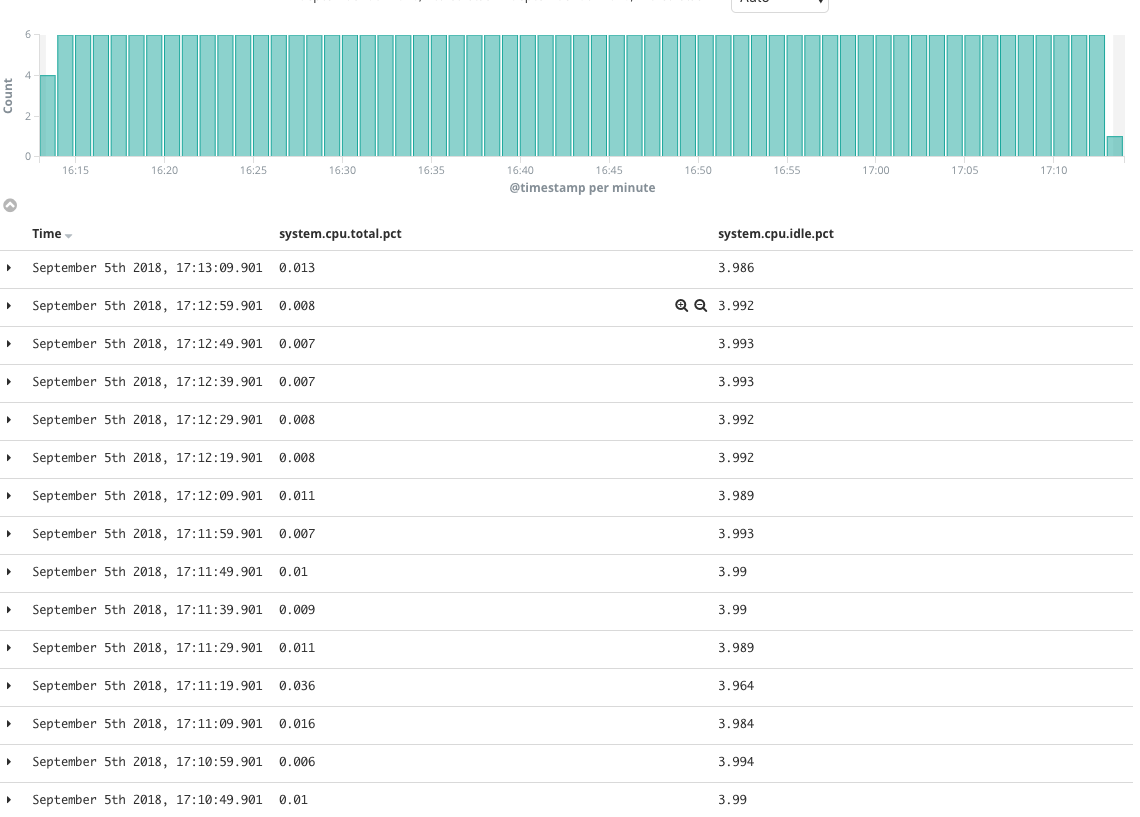
"max": {
"field": "system.cpu.idle.pct"
}
}
}
}
},
"stored_fields": [
"*"
],
"script_fields": {},
"docvalue_fields": [
"@timestamp",
"system.process.cpu.start_time"
],
"query": {
"bool": {
"must": [
{
"match_all": {}
},
{
"match_phrase": {
"component": {
"query": "ui"
}
}
},
{
"exists": {
"field": "system.cpu.idle.pct"
}
},
{
"range": {
"@timestamp": {
"gte": 1536164633286,
"lte": 1536168233286,
"format": "epoch_millis"
}
}
}
],
"filter": [],
"should": [],
"must_not": []
}
}
}
Response:
{
  "took": 10,
  "timed_out": false,
  "_shards": {
	"total": 25,
	"successful": 25,
	"skipped": 0,
	"failed": 0
  },
  "hits": {
	"total": 360,
	"max_score": 0,
	"hits": []
  },
  "aggregations": {
	"2": {
	  "buckets": [
		{
		  "1": {
			"value": 1
		  },
		  "key_as_string": "2018-09-05T17:23:00.000+01:00",
		  "key": 1536164580000,
		  "doc_count": 1
		},
		{
		  "1": {
			"value": 1
		  },
		  "key_as_string": "2018-09-05T17:24:00.000+01:00",
		  "key": 1536164640000,
		  "doc_count": 6
		},
		{
		  "1": {
			"value": 1
		  },
		  "key_as_string": "2018-09-05T17:25:00.000+01:00",
		  "key": 1536164700000,
		  "doc_count": 6
		},
		{
		  "1": {
			"value": 1
		  },
		  "key_as_string": "2018-09-05T17:26:00.000+01:00",
		  "key": 1536164760000,
		  "doc_count": 6
		},
		{
		  "1": {
			"value": 1
		  },
		  "key_as_string": "2018-09-05T17:27:00.000+01:00",
		  "key": 1536164820000,
		  "doc_count": 6
		},
		{
		  "1": {
			"value": 1
		  },
		  "key_as_string": "2018-09-05T17:28:00.000+01:00",
		  "key": 1536164880000,
		  "doc_count": 6
		},
		{
		  "1": {
			"value": 1
		  },
		  "key_as_string": "2018-09-05T17:29:00.000+01:00",
		  "key": 1536164940000,
		  "doc_count": 6
		},
		{
		  "1": {
			"value": 1
		  },
		  "key_as_string": "2018-09-05T17:30:00.000+01:00",
		  "key": 1536165000000,
		  "doc_count": 6
		},
		{
		  "1": {
			"value": 1
		  },
		  "key_as_string": "2018-09-05T17:31:00.000+01:00",
		  "key": 1536165060000,
		  "doc_count": 6
		},
		{
		  "1": {
			"value": 1
		  },
		  "key_as_string": "2018-09-05T17:32:00.000+01:00",
		  "key": 1536165120000,
		  "doc_count": 6
		},

		<.... snip ....>

		{
		  "1": {
			"value": 1
		  },
		  "key_as_string": "2018-09-05T18:14:00.000+01:00",
		  "key": 1536167640000,
		  "doc_count": 6
		},
		{
		  "1": {
			"value": 1
		  },
		  "key_as_string": "2018-09-05T18:15:00.000+01:00",
		  "key": 1536167700000,
		  "doc_count": 6
		},
		{
		  "1": {
			"value": 1
		  },
		  "key_as_string": "2018-09-05T18:16:00.000+01:00",
		  "key": 1536167760000,
		  "doc_count": 6
		},
		{
		  "1": {
			"value": 1
		  },
		  "key_as_string": "2018-09-05T18:17:00.000+01:00",
		  "key": 1536167820000,
		  "doc_count": 6
		},
		{
		  "1": {
			"value": 1
		  },
		  "key_as_string": "2018-09-05T18:18:00.000+01:00",
		  "key": 1536167880000,
		  "doc_count": 6
		},
		{
		  "1": {
			"value": 1
		  },
		  "key_as_string": "2018-09-05T18:19:00.000+01:00",
		  "key": 1536167940000,
		  "doc_count": 6
		},
		{
		  "1": {
			"value": 1
		  },
		  "key_as_string": "2018-09-05T18:20:00.000+01:00",
		  "key": 1536168000000,
		  "doc_count": 6
		},
		{
		  "1": {
			"value": 1
		  },
		  "key_as_string": "2018-09-05T18:21:00.000+01:00",
		  "key": 1536168060000,
		  "doc_count": 6
		},
		{
		  "1": {
			"value": 1
		  },
		  "key_as_string": "2018-09-05T18:22:00.000+01:00",
		  "key": 1536168120000,
		  "doc_count": 6
		},
		{
		  "1": {
			"value": 1
		  },
		  "key_as_string": "2018-09-05T18:23:00.000+01:00",
		  "key": 1536168180000,
		  "doc_count": 5
		}
	  ]
	}
  },
  "status": 200
}