Sum operator in stacked bar vega

Hi,

I have aggregated StatusOpen field using sum operator, grouped by text_sentiment and subject_line fields.

It's giving correct results in kibana.

I tried it in vega using below spec :

{
  "$schema": "https://vega.github.io/schema/vega-lite/v4.json",
  "width": 400,
      data: {
    url: {
      %context%: true
      index: index_dash_perf
      body: {
        size:500000
        _source: ["text_sentiment", "StatusOpen", "StatusSent", "StatusCode", "subject_line", "duplicates"]
        }
      }
      
      format: {property: "hits.hits"}
    },
  "transform": [
    {"filter": "datum._source.text_sentiment != null"},
      {"filter": "datum._source.duplicates != 0"},
      {
        "aggregate": [
        {"op": "sum", "field": "_source.StatusOpen","as": "aud_count"}
        ],
              "groupby": ["_source.subject_line","_source.text_sentiment"]
      }
    ],
  "encoding": {
    "x": {"field": "_source.subject_line", "type": "nominal", "title": null},
    "y": {"field": "aud_count", "type": "quantitative", "title": null},
    "color": {
        "field": "_source.text_sentiment",
        "type": "nominal",
        "title": "Sentiment",
        "scale":{"scheme": "lighttealblue"}
      }

  },
  "layer": [
  {
    "mark": "bar"
  }, {
    "mark": {
      "type": "text",
      "align": "left",
      "dx": -6,
      "dy": -5
    },
    "encoding": {
      "text": {"field": "aud_count", "type": "quantitative"}
    }
  }]
} 

Output :

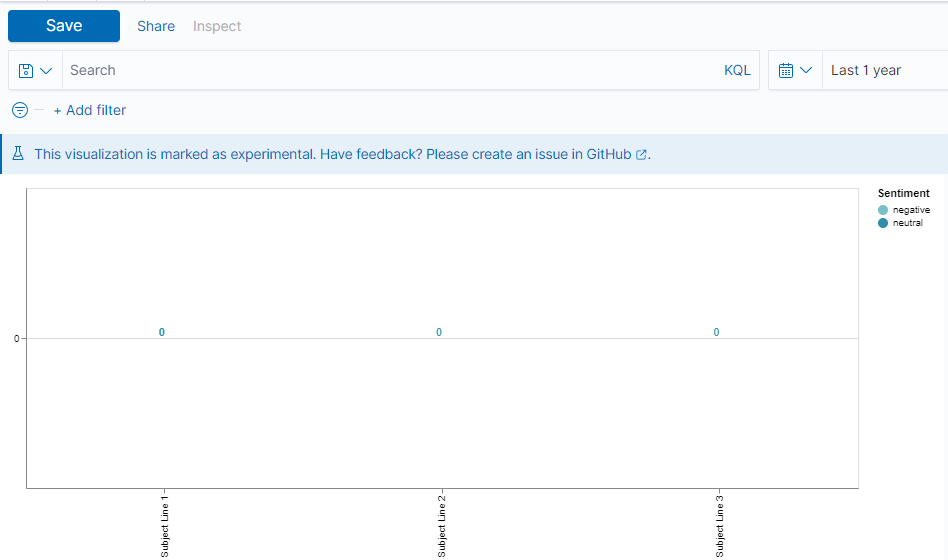
for count operator its giving correct results, sum operator is just giving 0.

I have some questions:

  1. If it's giving you correct results in Kibana, then why are you reproducing it in Vega?
  2. Are you aware that the way you're trying to reproduce it is not the same as what Kibana is using? From your Kibana bar chart, look at Inspect -> Request and you will see what the Elasticsearch request is showing

I wrote an example of using aggregated queries in the Vega docs, I think you can directly use those examples.

Hi @wylie

  1. The main visualization I require is % graph by dividing sum of StatusOpen/ sum of StatusSent, which was not giving expected output in vega-lite. So just wanted to check ouput for simple graph ( with sum of single field).

  2. Tried the same spec using sample data, it was giving correct results

{
  "$schema": "https://vega.github.io/schema/vega-lite/v4.json",
  "description": "Vega-Lite version of bar chart from https://observablehq.com/@d3/learn-d3-scales.",
  "width": 400,
  "data": {
    "values": [
      {"name": ":tangerine:", "count": 20, "gcount": "A", "hcount":21},
      {"name": ":tangerine:", "count": 21, "gcount": "A", "hcount": 8},
       {"name": ":tangerine:", "count": 8, "gcount": "B", "hcount": 8},
          {"name": ":tangerine:", "count": 11, "gcount": "B", "hcount": 8},
      {"name": ":banana:", "count": 10, "gcount": "C", "hcount": 5},
      {"name": ":grapes:", "count": 11, "gcount": "D", "hcount": 5},
      {"name": ":grapes:", "count": 10, "gcount": "E", "hcount": 20},
      {"name": ":watermelon:", "count": 11, "gcount": "F", "hcount": 21}
    ]
  },
  "transform": [
    
      {
        "aggregate": [{"op": "sum", "field": "count","as": "aud_count"}],
              "groupby": ["name","gcount"]
      },
        
    ],
  "encoding": {
    "x": {"field": "name", "type": "nominal", "title": null},
    "y": {"field": "aud_count", "type": "quantitative", "title": null},
    "color": {
        "field": "gcount",
        "type": "nominal",
        "title": "Sentiment",
        "scale":{"scheme": "paired"}
      }

  },
  "layer": [
  {
    "mark": "bar"
  }, {
    "mark": {
      "type": "text",
      "align": "left",
      "dx": -6,
      "dy": -5
    },
    "encoding": {
      "text": {"field": "aud_count", "type": "quantitative"}
    }
  }]
} 

Output :

If joinaggregate is used in place of aggregate in the main spec, it's giving correct results but Y axis is going upto 9000000. It's weird that bar length is coming right for Y axis values where as Y-axis labels showing way higher values.

{
  "$schema": "https://vega.github.io/schema/vega-lite/v4.json",
  "width": 400,
      data: {
    url: {
      %context%: true
      index: index_dash_perf
      body: {
        size:20000
        _source: ["text_sentiment", "StatusOpen", "StatusSent", "StatusCode", "subject_line", "duplicates"]
        }
      }
      
      format: {property: "hits.hits"}
    },
  "transform": [
    {"filter": "datum._source.text_sentiment != null"},
      {"filter": "datum._source.duplicates != 0"},
      {
        "joinaggregate": [
        {"op": "sum", "field": "_source.StatusOpen","as": "aud_count"}
        ],
              "groupby": ["_source.subject_line","_source.text_sentiment"]
      }
    ],
  "encoding": {
    "x": {"field": "_source.subject_line", "type": "nominal", "title": null},
    "y": {"field": "aud_count", "type": "quantitative", "title": null},
     "color": {
        "field": "_source.text_sentiment",
        "type": "nominal",
        "title": "Sentiment",
        "scale":{"scheme": "blues"}
      }


  },
  "layer": [
  {
    "mark": "bar"
  }, {
    "mark": {
      "type": "text",
      "align": "left",
      "dx": -6,
      "dy": -5
    },
    "encoding": {
      "text": {"field": "aud_count", "type": "quantitative"}
    }
  }]
} 

Output :

You still aren't running the same query as Visualize:

Are you aware that the way you're trying to reproduce it is not the same as what Kibana is using? From your Kibana bar chart, look at Inspect -> Request and you will see what the Elasticsearch request is showing

This topic was automatically closed 28 days after the last reply. New replies are no longer allowed.