Elastic: 7.15.2 (ECE)
Kibana: 7.15.2 (ECE)
APM Server: 7.17.3 (ECK)
ECS: 1.12.0
We have a setup with multiple spaces and multiple teams ingesting apm data using apm server. The data for my team is located in indices on a data stream with the pattern traces-apm.- while other teams not started with data streams have their indices in apm-*
In the trace samples on a transaction we receive an error message:
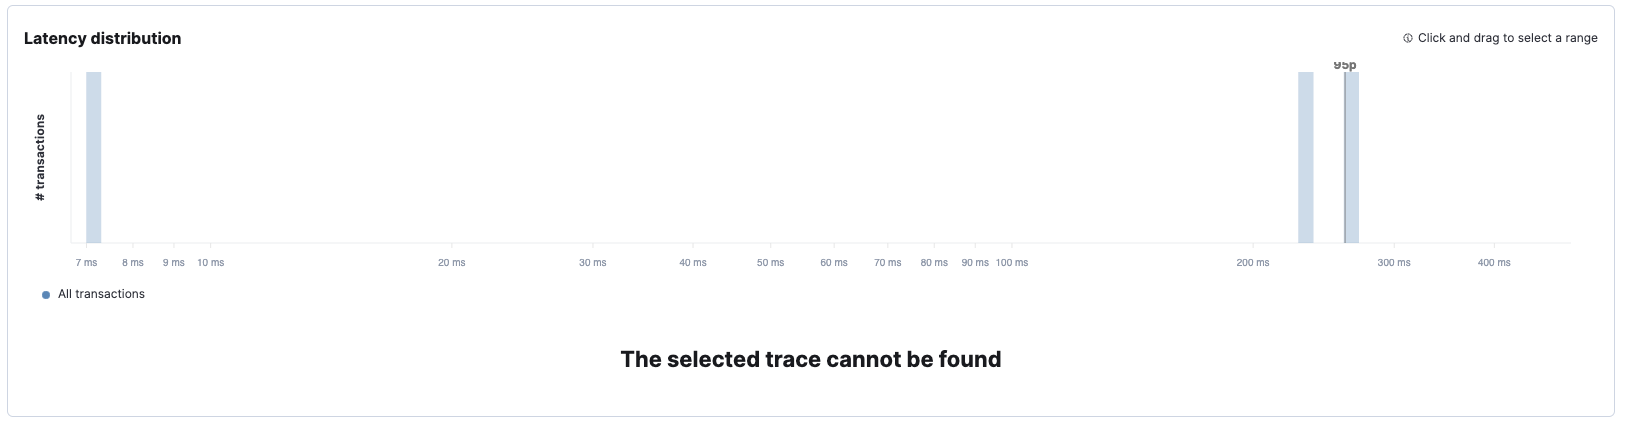
While debugging I found the following api call:
https://ops.ece.tv2.no/s/rp/api/apm/traces/1600835dedde53f2c0134aa55d4de2bc?start=2022-05-02T12:00:00.000Z&end=2022-05-03T12:29:35.119Z
Which responds with:
{
"trace": {
"items": [],
"exceedsMax": false,
"errorDocs": []
},
"errorsPerTransaction": {}
}
I thus went to discover and searched up the entries I was expecting to see:

My next thought was that there is a problem with the settings in APM module in Kibana, but this looks correct to me:

This should? map to my data streams:

Anyone know why the api responds with empty trace? Transactions which are in apm-* indices (without data stream) responds with items in the trace.items object like this (removed most content for brevity):
{
"trace": {
"items": [
{
"container": {
"id": "4ea0c34e6de0358cc36f9b4a790f347a1c7cee4cb48991092c52e18f17133b5b"
},
"kubernetes": {},
"agent": {},
"source": {},
"cloud": {},
"observer": {},
"trace": {},
"ecs": {},
"host": {},
"client": {},
"event": {},
"user_agent": {},
"timestamp": {},
"process": {},
"processor": {},
"url": {},
"@timestamp": "2022-05-03T11:21:14.575Z",
"service": {},
"http": {},
"transaction": {
"result": "HTTP 2xx",
"duration": {},
"name": "GET /v4/feed/{feedId}",
"span_count": {},
"id": "026f94125aa4ac75",
"type": "request",
"sampled": true
}
},
{},
{}
],
"exceedsMax": false,
"errorDocs": []
},
"errorsPerTransaction": {}
}