Hello there!
After a considerable time optimizing and testing different configurations, I have no idea why my ES nodes uses so much of a JVM heap, with not so many shards in a cluster. I’m definitely missing something, but what?
Elastic Stack version is 6.7.2
Cluster consist of 5 ES nodes (each running in its Docker container), each node has 64 GB RAM, 32 CPU cores. There is clearly enough storage on HDDs
JDK version:
openjdk version "11.0.2" 2019-01-15
OpenJDK Runtime Environment 18.9 (build 11.0.2+9)
OpenJDK 64-Bit Server VM 18.9 (build 11.0.2+9, mixed mode)
Every ES node have this jvm.options:
-Xms32768m
-Xmx32768m
-XX:NewRatio=2
10-:-XX:-UseConcMarkSweepGC
10-:-XX:-UseCMSInitiatingOccupancyOnly
10-:-XX:+UseG1GC
10-:-XX:InitiatingHeapOccupancyPercent=75
-Des.networkaddress.cache.ttl=60
-Des.networkaddress.cache.negative.ttl=10
-XX:+AlwaysPreTouch
-Xss1m
-Djava.awt.headless=true
-Dfile.encoding=UTF-8
-Djna.nosys=true
-XX:-OmitStackTraceInFastThrow
-Dio.netty.noUnsafe=true
-Dio.netty.noKeySetOptimization=true
-Dio.netty.recycler.maxCapacityPerThread=0
-Dlog4j.shutdownHookEnabled=false
-Dlog4j2.disable.jmx=true
-Djava.io.tmpdir=${ES_TMPDIR}
-XX:+HeapDumpOnOutOfMemoryError
-XX:HeapDumpPath=data
-XX:ErrorFile=logs/hs_err_pid%p.log
8:-XX:+PrintGCDetails
8:-XX:+PrintGCDateStamps
8:-XX:+PrintTenuringDistribution
8:-XX:+PrintGCApplicationStoppedTime
8:-Xloggc:logs/gc.log
8:-XX:+UseGCLogFileRotation
8:-XX:NumberOfGCLogFiles=32
8:-XX:GCLogFileSize=64m
9-:-Xlog:gc*,gc+age=trace,safepoint:file=logs/gc.log:utctime,pid,tags:filecount=32,filesize=64m
# due to internationalization enhancements in JDK 9 Elasticsearch need to set the provider to COMPAT otherwise
9-:-Djava.locale.providers=COMPAT
10-:-XX:UseAVX=2
There is 315 timely-rotating indices (+/- 2 indices, depends on Curator actions), where:
- Daily Indices “A” are usually 730 GB big (530 GB on weekends) – 7 shards, 1 replica
- Weekly indices “B” are usually 220 GB big – 2 shards, 1 replica
- Monthly indices “C” are usually 160 GB big – 6 shards, 1 replica
- Monthly indices “D” are usually 800 MB big – 1 shard, 1 replica
- Weekly indices “E” are usually 400 GB big – 3 shards, 1 replica
- Weekly indices “F” are usually 400 GB big – 5 shards, 1 replica
- Monthly indices “G” are usually 10 GB big – 1 shard, 1 replica
There is only about 15 indices that are yearly (few hundred MBs, 1 shard, 1 replica), but considering the possible volatility of log volume in indices “D” and “G”, I can’t risk migrating them to yearly indices. Indices “C” were twice as bigger in past, that’s why I left them on 6 shards... will definitely lower the number of shards for future indices (and shrink for past indices) to 3 shards.
Yes I know, most of these indices can be optimized, according to storage capacity they take on disk, with +/- 1 shard. Still, correct me if I’m wrong - if I have 31 GB JVM Heap size on one node, such node can deal with max 600 shards that ideally take 10GB-50GB of data. Following the info (above) I mentioned about my indices and retention period of 3 months, I should have about 1600-1700 shards active in cluster, which is about 320 shards per node.
At 200 shards per node my cluster was “dying” - Kibana timeouts (ES API overall), Logstash logs emitted rate very low, etc. also all of my ES nodes had a lot of this messages (every few seconds) in cluster logs:
[2021-07-09T03:52:45,630][WARN ][o.e.m.j.JvmGcMonitorService] [elasticsearch-node0] [gc][25848] overhead, spent [2s] collecting in the last [2.5s]
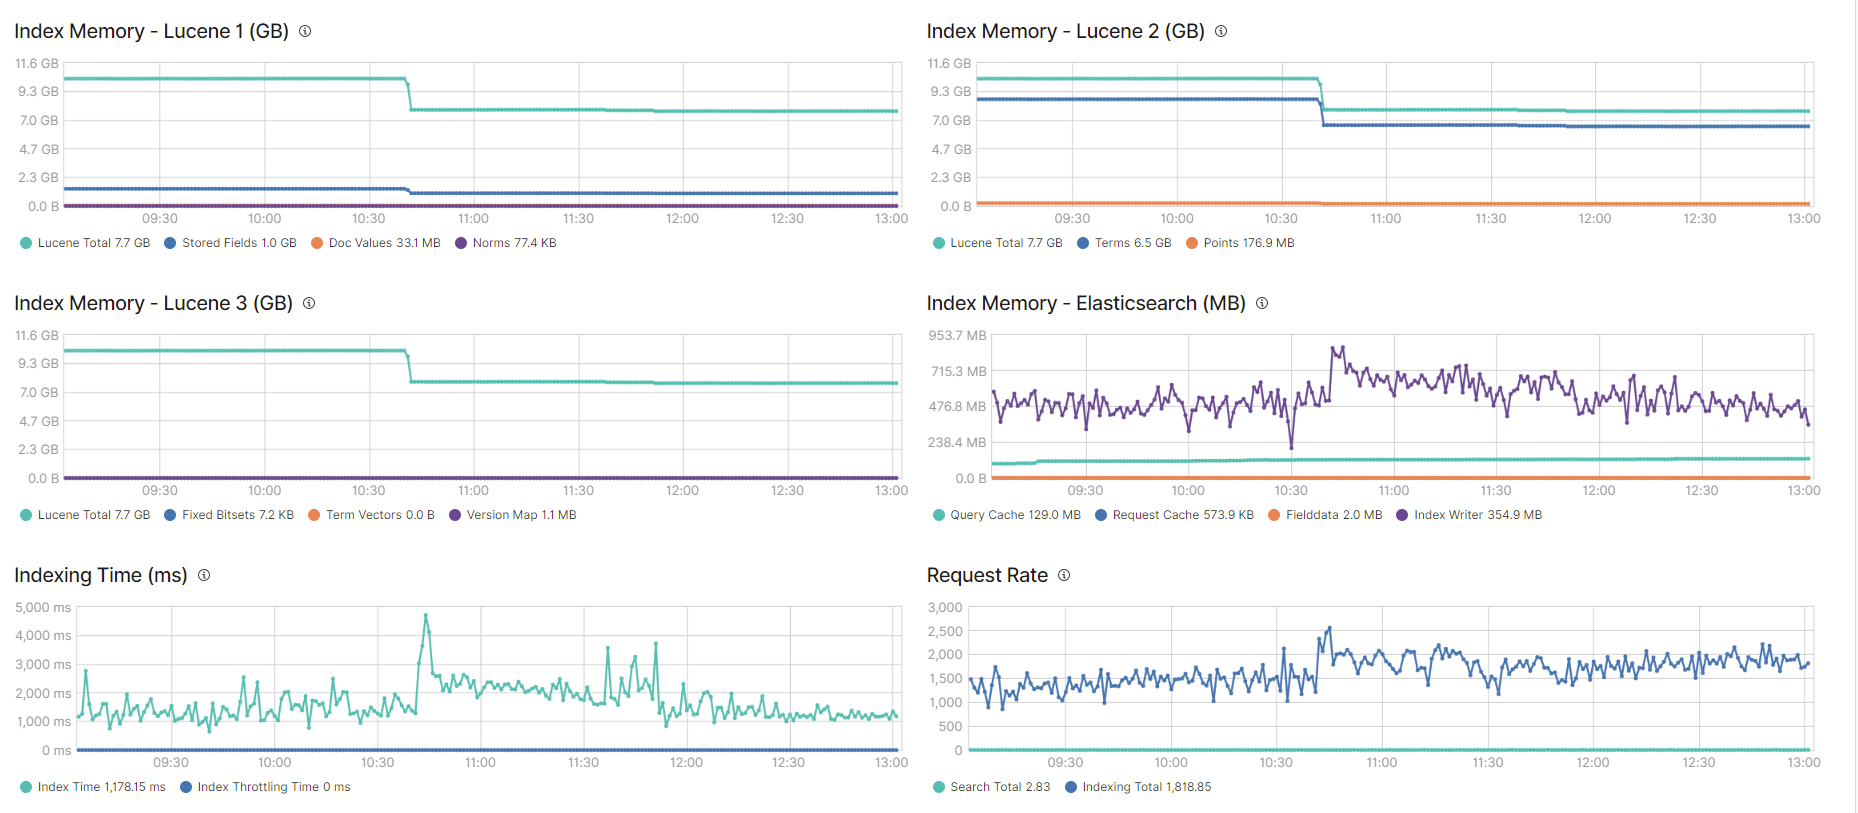
Then I close about 20 indices and cluster performance was significantly better (no Kibana timeouts, normal logs emitted rate by Logstash, etc). I took a screenshot of my ES Nodes Monitoring section:

Also, on the images below, you can see Overview and Advanced graphs on one for the nodes - quite similar graph values are on all of the 5 nodes (notice the red arrows - that's the period when I closed 20 indices):


"Striped" output of _node/stats API for one of the nodes:
{
  "timestamp" : 1625837474508,
  "name" : "elasticsearch-node0",
  "transport_address" : "10.0.0.195:9300",
  "host" : "10.0.0.195",
  "ip" : "10.0.0.195:9300",
  "roles" : [
    "master",
    "data",
    "ingest"
  ],
  "attributes" : {
    "ml.machine_memory" : "67151585280",
    "xpack.installed" : "true",
    "ml.max_open_jobs" : "20",
    "ml.enabled" : "true"
  },
  "indices" : {
    "docs" : {
      "count" : 2857527884,
      "deleted" : 6
    },
    "store" : {
      "size_in_bytes" : 5572660647652
    },
    "indexing" : {
      "index_total" : 63089414,
      "index_time_in_millis" : 58053777,
      "index_current" : 0,
      "index_failed" : 0,
      "delete_total" : 5314,
      "delete_time_in_millis" : 263,
      "delete_current" : 0,
      "noop_update_total" : 0,
      "is_throttled" : false,
      "throttle_time_in_millis" : 0
    },
    "search" : {
      "open_contexts" : 0,
      "query_total" : 99215,
      "query_time_in_millis" : 3852985,
      "query_current" : 0,
      "fetch_total" : 10869,
      "fetch_time_in_millis" : 24792,
      "fetch_current" : 0,
      "scroll_total" : 28636,
      "scroll_time_in_millis" : 1696355964,
      "scroll_current" : 4,
      "suggest_total" : 0,
      "suggest_time_in_millis" : 0,
      "suggest_current" : 0
    },
    "merges" : {
      "current" : 3,
      "current_docs" : 11051914,
      "current_size_in_bytes" : 11327555108,
      "total" : 15773,
      "total_time_in_millis" : 97119159,
      "total_docs" : 239746379,
      "total_size_in_bytes" : 395064523800,
      "total_stopped_time_in_millis" : 0,
      "total_throttled_time_in_millis" : 76073250,
      "total_auto_throttle_in_bytes" : 3850782460
    },
    "refresh" : {
      "total" : 66535,
      "total_time_in_millis" : 6307176,
      "listeners" : 0
    },
    "flush" : {
      "total" : 493,
      "periodic" : 244,
      "total_time_in_millis" : 530956
    },
    "warmer" : {
      "current" : 0,
      "total" : 59137,
      "total_time_in_millis" : 4953
    },
    "query_cache" : {
      "memory_size_in_bytes" : 144392136,
      "total_count" : 5969326,
      "hit_count" : 135527,
      "miss_count" : 5833799,
      "cache_size" : 1064,
      "cache_count" : 2622,
      "evictions" : 1558
    },
    "fielddata" : {
      "memory_size_in_bytes" : 2094144,
      "evictions" : 0
    },
    "completion" : {
      "size_in_bytes" : 0
    },
    "segments" : {
      "count" : 4389,
      "memory_in_bytes" : 8326247746,
      "terms_memory_in_bytes" : 6990788892,
      "stored_fields_memory_in_bytes" : 1114132112,
      "term_vectors_memory_in_bytes" : 0,
      "norms_memory_in_bytes" : 84480,
      "points_memory_in_bytes" : 186489802,
      "doc_values_memory_in_bytes" : 34752460,
      "index_writer_memory_in_bytes" : 326691289,
      "version_map_memory_in_bytes" : 1922,
      "fixed_bit_set_memory_in_bytes" : 7384,
      "max_unsafe_auto_id_timestamp" : 1625831845465,
      "file_sizes" : { }
    },
    "translog" : {
      "operations" : 3204038,
      "size_in_bytes" : 5353055060,
      "uncommitted_operations" : 1958679,
      "uncommitted_size_in_bytes" : 3268641912,
      "earliest_last_modified_age" : 0
    },
    "request_cache" : {
      "memory_size_in_bytes" : 582347,
      "evictions" : 0,
      "hit_count" : 406,
      "miss_count" : 423
    },
    "recovery" : {
      "current_as_source" : 0,
      "current_as_target" : 0,
      "throttle_time_in_millis" : 1894860
    }
  },
  "os" : {
    "timestamp" : 1625837477914,
    "cpu" : {
      "percent" : 12,
      "load_average" : {
        "1m" : 5.07,
        "5m" : 4.96,
        "15m" : 5.01
      }
    },
    "mem" : {
      "total_in_bytes" : 67151585280,
      "free_in_bytes" : 470204416,
      "used_in_bytes" : 66681380864,
      "free_percent" : 1,
      "used_percent" : 99
    },
    "swap" : {
      "total_in_bytes" : 0,
      "free_in_bytes" : 0,
      "used_in_bytes" : 0
    },
    "cgroup" : {
      "cpuacct" : {
        "control_group" : "/",
        "usage_nanos" : 197301219127459
      },
      "cpu" : {
        "control_group" : "/",
        "cfs_period_micros" : 100000,
        "cfs_quota_micros" : -1,
        "stat" : {
          "number_of_elapsed_periods" : 0,
          "number_of_times_throttled" : 0,
          "time_throttled_nanos" : 0
        }
      },
      "memory" : {
        "control_group" : "/",
        "limit_in_bytes" : "9223372036854771712",
        "usage_in_bytes" : "64025772032"
      }
    }
  },
  "process" : {
    "timestamp" : 1625837477914,
    "open_file_descriptors" : 1556,
    "max_file_descriptors" : 65536,
    "cpu" : {
      "percent" : 12,
      "total_in_millis" : 197299520
    },
    "mem" : {
      "total_virtual_in_bytes" : 5608245342208
    }
  },
  "jvm" : {
    "timestamp" : 1625837477915,
    "uptime_in_millis" : 61324914,
    "mem" : {
      "heap_used_in_bytes" : 31318506960,
      "heap_used_percent" : 91,
      "heap_committed_in_bytes" : 34359738368,
      "heap_max_in_bytes" : 34359738368,
      "non_heap_used_in_bytes" : 184341472,
      "non_heap_committed_in_bytes" : 225312768,
      "pools" : {
        "young" : {
          "used_in_bytes" : 10619977728,
          "max_in_bytes" : 0,
          "peak_used_in_bytes" : 11442061312,
          "peak_max_in_bytes" : 0
        },
        "old" : {
          "used_in_bytes" : 20195212752,
          "max_in_bytes" : 34359738368,
          "peak_used_in_bytes" : 34359738368,
          "peak_max_in_bytes" : 34359738368
        },
        "survivor" : {
          "used_in_bytes" : 503316480,
          "max_in_bytes" : 0,
          "peak_used_in_bytes" : 1442840576,
          "peak_max_in_bytes" : 0
        }
      }
    },
    "threads" : {
      "count" : 321,
      "peak_count" : 396
    },
    "gc" : {
      "collectors" : {
        "young" : {
          "collection_count" : 5986,
          "collection_time_in_millis" : 338246
        },
        "old" : {
          "collection_count" : 1528,
          "collection_time_in_millis" : 2796699
        }
      }
    },
    "buffer_pools" : {
      "mapped" : {
        "count" : 12572,
        "used_in_bytes" : 5553175857927,
        "total_capacity_in_bytes" : 5553175857927
      },
      "direct" : {
        "count" : 362,
        "used_in_bytes" : 1838783459,
        "total_capacity_in_bytes" : 1838783458
      }
    },
    "classes" : {
      "current_loaded_count" : 19650,
      "total_loaded_count" : 20695,
      "total_unloaded_count" : 1045
    }
  },
  "fs" : {
    "io_stats" : {
      "devices" : [
        {
          "device_name" : "dm-1",
          "operations" : 60515516,
          "read_operations" : 2721390,
          "write_operations" : 57794126,
          "read_kilobytes" : 324560152,
          "write_kilobytes" : 1584071716
        }
      ],
      "total" : {
        "operations" : 60515516,
        "read_operations" : 2721390,
        "write_operations" : 57794126,
        "read_kilobytes" : 324560152,
        "write_kilobytes" : 1584071716
      }
    }
  },
  "transport" : {
    "server_open" : 52,
    "rx_count" : 22198209,
    "rx_size_in_bytes" : 389066700224,
    "tx_count" : 22198256,
    "tx_size_in_bytes" : 294157797987
  },
  "http" : {
    "current_open" : 106,
    "total_opened" : 27478
  },
  "breakers" : {
    "request" : {
      "limit_size_in_bytes" : 20615843020,
      "limit_size" : "19.1gb",
      "estimated_size_in_bytes" : 0,
      "estimated_size" : "0b",
      "overhead" : 1.0,
      "tripped" : 0
    },
    "fielddata" : {
      "limit_size_in_bytes" : 20615843020,
      "limit_size" : "19.1gb",
      "estimated_size_in_bytes" : 2094144,
      "estimated_size" : "1.9mb",
      "overhead" : 1.03,
      "tripped" : 0
    },
    "in_flight_requests" : {
      "limit_size_in_bytes" : 34359738368,
      "limit_size" : "32gb",
      "estimated_size_in_bytes" : 3436,
      "estimated_size" : "3.3kb",
      "overhead" : 1.0,
      "tripped" : 0
    },
    "accounting" : {
      "limit_size_in_bytes" : 34359738368,
      "limit_size" : "32gb",
      "estimated_size_in_bytes" : 8326232996,
      "estimated_size" : "7.7gb",
      "overhead" : 1.0,
      "tripped" : 0
    },
    "parent" : {
      "limit_size_in_bytes" : 24051816857,
      "limit_size" : "22.3gb",
      "estimated_size_in_bytes" : 8328330576,
      "estimated_size" : "7.7gb",
      "overhead" : 1.0,
      "tripped" : 0
    }
  }
}
So, what am I missing? Why do I get poor performance with 200 shards per node, even if I have 32 GB of Heap and “normally” sized shards on my indices?
Thanks in advance!