Dear,
We've encounter 'random' out of memory errors that we can't explain. When we see the error occur we don't see an increase of Heap, system load, CPU or I/O. So I don't know where to search for the explanation why this error occures.
Welcome to our community! 
What version are you on?
What do your Elasticsearch logs show?
What is the output from the _cluster/stats?pretty&human API?
Thanks for the fast reaction.
We're running 7.12
The elasticsearch log contains a lot of information, any specific I could search for to show you?
The output of _cluster/stats?pretty&human:
{
	"_nodes": {
		"total": 3,
		"successful": 3,
		"failed": 0
	},
	"cluster_name": "pv_elastic",
	"cluster_uuid": "CLUSTERID",
	"timestamp": 1618394691563,
	"status": "green",
	"indices": {
		"count": 47,
		"shards": {
			"total": 94,
			"primaries": 47,
			"replication": 1.0,
			"index": {
				"shards": {
					"min": 2,
					"max": 2,
					"avg": 2.0
				},
				"primaries": {
					"min": 1,
					"max": 1,
					"avg": 1.0
				},
				"replication": {
					"min": 1.0,
					"max": 1.0,
					"avg": 1.0
				}
			}
		},
		"docs": {
			"count": 113162098,
			"deleted": 2525758
		},
		"store": {
			"size": "167gb",
			"size_in_bytes": 179357458993,
			"reserved": "0b",
			"reserved_in_bytes": 0
		},
		"fielddata": {
			"memory_size": "33.8mb",
			"memory_size_in_bytes": 35485020,
			"evictions": 0
		},
		"query_cache": {
			"memory_size": "82.9mb",
			"memory_size_in_bytes": 87018999,
			"total_count": 38552219,
			"hit_count": 10393035,
			"miss_count": 28159184,
			"cache_size": 8056,
			"cache_count": 24617,
			"evictions": 16561
		},
		"completion": {
			"size": "0b",
			"size_in_bytes": 0
		},
		"segments": {
			"count": 1017,
			"memory": "21.7mb",
			"memory_in_bytes": 22845792,
			"terms_memory": "9.7mb",
			"terms_memory_in_bytes": 10186536,
			"stored_fields_memory": "1mb",
			"stored_fields_memory_in_bytes": 1138280,
			"term_vectors_memory": "0b",
			"term_vectors_memory_in_bytes": 0,
			"norms_memory": "1.1mb",
			"norms_memory_in_bytes": 1173248,
			"points_memory": "0b",
			"points_memory_in_bytes": 0,
			"doc_values_memory": "9.8mb",
			"doc_values_memory_in_bytes": 10347728,
			"index_writer_memory": "91mb",
			"index_writer_memory_in_bytes": 95473368,
			"version_map_memory": "150.9kb",
			"version_map_memory_in_bytes": 154523,
			"fixed_bit_set": "8.4mb",
			"fixed_bit_set_memory_in_bytes": 8912048,
			"max_unsafe_auto_id_timestamp": 1618367450870,
			"file_sizes": {}
		},
		"mappings": {
			"field_types": [{
					"name": "alias",
					"count": 3,
					"index_count": 1
				}, {
					"name": "boolean",
					"count": 162,
					"index_count": 24
				}, {
					"name": "byte",
					"count": 1,
					"index_count": 1
				}, {
					"name": "date",
					"count": 281,
					"index_count": 37
				}, {
					"name": "double",
					"count": 171,
					"index_count": 5
				}, {
					"name": "float",
					"count": 223,
					"index_count": 5
				}, {
					"name": "geo_point",
					"count": 7,
					"index_count": 1
				}, {
					"name": "half_float",
					"count": 35,
					"index_count": 7
				}, {
					"name": "integer",
					"count": 238,
					"index_count": 11
				}, {
					"name": "ip",
					"count": 21,
					"index_count": 1
				}, {
					"name": "keyword",
					"count": 2093,
					"index_count": 38
				}, {
					"name": "long",
					"count": 3770,
					"index_count": 34
				}, {
					"name": "nested",
					"count": 33,
					"index_count": 14
				}, {
					"name": "object",
					"count": 3387,
					"index_count": 38
				}, {
					"name": "scaled_float",
					"count": 135,
					"index_count": 1
				}, {
					"name": "text",
					"count": 898,
					"index_count": 38
				}
			]
		},
		"analysis": {
			"char_filter_types": [],
			"tokenizer_types": [],
			"filter_types": [],
			"analyzer_types": [],
			"built_in_char_filters": [],
			"built_in_tokenizers": [],
			"built_in_filters": [],
			"built_in_analyzers": []
		},
		"versions": [{
				"version": "7.9.1",
				"index_count": 6,
				"primary_shard_count": 6,
				"total_primary_size": "1.1gb",
				"total_primary_bytes": 1274192036
			}, {
				"version": "7.9.2",
				"index_count": 26,
				"primary_shard_count": 26,
				"total_primary_size": "74.9gb",
				"total_primary_bytes": 80526147186
			}, {
				"version": "7.12.0",
				"index_count": 15,
				"primary_shard_count": 15,
				"total_primary_size": "6.7gb",
				"total_primary_bytes": 7206221123
			}
		]
	},
	"nodes": {
		"count": {
			"total": 3,
			"coordinating_only": 0,
			"data": 2,
			"data_cold": 2,
			"data_content": 2,
			"data_frozen": 2,
			"data_hot": 2,
			"data_warm": 2,
			"ingest": 2,
			"master": 3,
			"ml": 2,
			"remote_cluster_client": 3,
			"transform": 2,
			"voting_only": 0
		},
		"versions": [
			"7.12.0"
		],
		"os": {
			"available_processors": 9,
			"allocated_processors": 9,
			"names": [{
					"name": "Linux",
					"count": 3
				}
			],
			"pretty_names": [{
					"pretty_name": "Ubuntu 18.04.5 LTS",
					"count": 3
				}
			],
			"architectures": [{
					"arch": "amd64",
					"count": 3
				}
			],
			"mem": {
				"total": "41.1gb",
				"total_in_bytes": 44184449024,
				"free": "6.7gb",
				"free_in_bytes": 7239434240,
				"used": "34.4gb",
				"used_in_bytes": 36945014784,
				"free_percent": 16,
				"used_percent": 84
			}
		},
		"process": {
			"cpu": {
				"percent": 1
			},
			"open_file_descriptors": {
				"min": 353,
				"max": 833,
				"avg": 656
			}
		},
		"jvm": {
			"max_uptime": "9.8d",
			"max_uptime_in_millis": 854907155,
			"versions": [{
					"version": "15.0.1",
					"vm_name": "OpenJDK 64-Bit Server VM",
					"vm_version": "15.0.1+9",
					"vm_vendor": "AdoptOpenJDK",
					"bundled_jdk": true,
					"using_bundled_jdk": true,
					"count": 3
				}
			],
			"mem": {
				"heap_used": "11.5gb",
				"heap_used_in_bytes": 12412287152,
				"heap_max": "21gb",
				"heap_max_in_bytes": 22548578304
			},
			"threads": 158
		},
		"fs": {
			"total": "471.8gb",
			"total_in_bytes": 506633453568,
			"free": "282.1gb",
			"free_in_bytes": 302989135872,
			"available": "261.7gb",
			"available_in_bytes": 281035505664
		},
		"plugins": [],
		"network_types": {
			"transport_types": {
				"security4": 3
			},
			"http_types": {
				"security4": 3
			}
		},
		"discovery_types": {
			"zen": 3
		},
		"packaging_types": [{
				"flavor": "default",
				"type": "deb",
				"count": 3
			}
		],
		"ingest": {
			"number_of_pipelines": 2,
			"processor_stats": {
				"gsub": {
					"count": 0,
					"failed": 0,
					"current": 0,
					"time": "0s",
					"time_in_millis": 0
				},
				"script": {
					"count": 0,
					"failed": 0,
					"current": 0,
					"time": "0s",
					"time_in_millis": 0
				}
			}
		}
	}
}
You should make sure all nodes are on the same version.
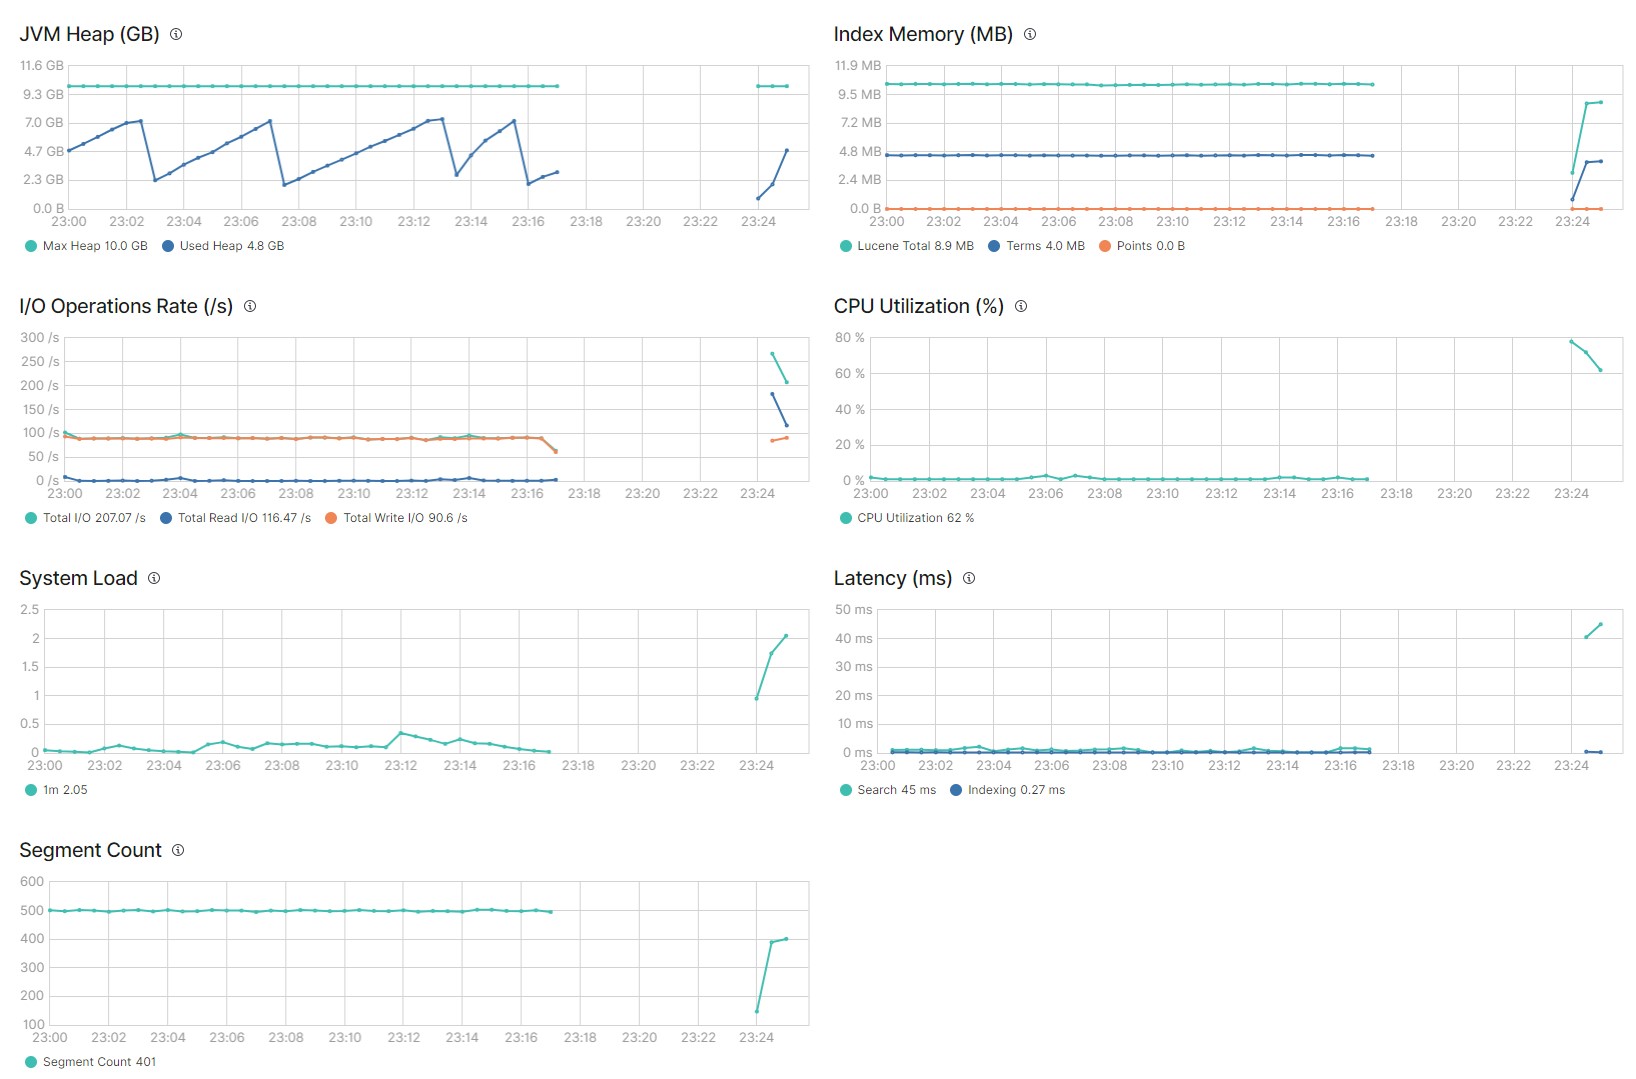
Before and after the OOM.
It's to large to post in the reply so here on pastebin: [2021-04-12T23:17:58,854][WARN ][o.e.t.TaskCancellationService] [es02] Cannot se - Pastebin.com
I can't see an OOM in there?
Sorry, I had the log of the wrong ES server I guess. Hereby the other containing the OutOfMemory error.
Are you 100% sure all nodes are on the same version, can you run GET /_cat/nodes?v&h=v,n,ip?
They are now, so I'll monitor if any problems occur. You think the problem is caused by different versions?
v n ip
7.12.0 es03 [IP].157
7.12.0 lbs02 [IP].131
7.12.0 es02 [IP].156
@warkolm The nodes are all the same version. The list of versions you listed are the version various indices were created under.
Thanks for answering and explanation
So the versions wasn't a problem to begin with?
No, I misread it.
No problem  , you've got any other idea how to find out what the problem could be or where I should look when it occurs again?
It happened again: [2021-04-22T17:38:45,148][INFO ][o.e.m.j.JvmGcMonitorService] [es03] [gc][178796 - Pastebin.com
[2021-04-22T17:41:44,443][ERROR][o.e.ExceptionsHelper     ] [es03] fatal error
        at org.elasticsearch.ExceptionsHelper.lambda$maybeDieOnAnotherThread$4(ExceptionsHelper.java:283)
        at java.base/java.util.Optional.ifPresent(Optional.java:176)
        at org.elasticsearch.ExceptionsHelper.maybeDieOnAnotherThread(ExceptionsHelper.java:273)
        at org.elasticsearch.transport.netty4.Netty4MessageChannelHandler.exceptionCaught(Netty4MessageChannelHandler.java:70)
        at io.netty.channel.AbstractChannelHandlerContext.invokeExceptionCaught(AbstractChannelHandlerContext.java:302)
        at io.netty.channel.AbstractChannelHandlerContext.invokeChannelRead(AbstractChannelHandlerContext.java:381)
        at io.netty.channel.AbstractChannelHandlerContext.invokeChannelRead(AbstractChannelHandlerContext.java:365)
        at io.netty.channel.AbstractChannelHandlerContext.fireChannelRead(AbstractChannelHandlerContext.java:357)
        at io.netty.handler.logging.LoggingHandler.channelRead(LoggingHandler.java:271)
        at io.netty.channel.AbstractChannelHandlerContext.invokeChannelRead(AbstractChannelHandlerContext.java:379)
        at io.netty.channel.AbstractChannelHandlerContext.invokeChannelRead(AbstractChannelHandlerContext.java:365)
        at io.netty.channel.AbstractChannelHandlerContext.fireChannelRead(AbstractChannelHandlerContext.java:357)
        at io.netty.channel.DefaultChannelPipeline$HeadContext.channelRead(DefaultChannelPipeline.java:1410)
        at io.netty.channel.AbstractChannelHandlerContext.invokeChannelRead(AbstractChannelHandlerContext.java:379)
        at io.netty.channel.AbstractChannelHandlerContext.invokeChannelRead(AbstractChannelHandlerContext.java:365)
        at io.netty.channel.DefaultChannelPipeline.fireChannelRead(DefaultChannelPipeline.java:919)
        at io.netty.channel.nio.AbstractNioByteChannel$NioByteUnsafe.read(AbstractNioByteChannel.java:163)
        at io.netty.channel.nio.NioEventLoop.processSelectedKey(NioEventLoop.java:714)
        at io.netty.channel.nio.NioEventLoop.processSelectedKeysPlain(NioEventLoop.java:615)
        at io.netty.channel.nio.NioEventLoop.processSelectedKeys(NioEventLoop.java:578)
        at io.netty.channel.nio.NioEventLoop.run(NioEventLoop.java:493)
        at io.netty.util.concurrent.SingleThreadEventExecutor$4.run(SingleThreadEventExecutor.java:989)
        at io.netty.util.internal.ThreadExecutorMap$2.run(ThreadExecutorMap.java:74)
        at java.base/java.lang.Thread.run(Thread.java:832)
[2021-04-22T17:41:44,442][WARN ][o.e.t.InboundHandler     ] [es03] handling inbound transport message [InboundMessage{Header{1765853364}{7.12.0}{3464870}{false}{false}{false}{false}{NO_ACTION_NAME_FOR_RESPONSES}}] took [8188ms] which is above the warn threshold of [5000ms]
[2021-04-22T17:41:44,450][WARN ][o.e.t.OutboundHandler    ] [es03] sending transport message [MessageSerializer{Request{internal:coordination/fault_detection/leader_check}{3465028}{false}{false}{false}}] of size [544] on [Netty4TcpChannel{localAddress=/[IP].157:42042, remoteAddress=[IP].131/[IP].131:9300, profile=default}] took [7768ms] which is above the warn threshold of [5000ms]
[2021-04-22T17:41:44,450][WARN ][o.e.t.OutboundHandler    ] [es03] sending transport message [MessageSerializer{Request{indices:data/write/bulk[s]}{3465030}{false}{false}{false}}] of size [2072] on [Netty4TcpChannel{localAddress=/[IP].157:37364, remoteAddress=[IP].156/[IP].156:9300, profile=default}] took [6714ms] which is above the warn threshold of [5000ms]
[2021-04-22T17:41:44,450][WARN ][o.e.t.OutboundHandler    ] [es03] sending transport message [MessageSerializer{Request{indices:data/write/bulk[s]}{3465033}{false}{false}{false}}] of size [1284] on [Netty4TcpChannel{localAddress=/[IP].157:37364, remoteAddress=[IP].156/[IP].156:9300, profile=default}] took [6714ms] which is above the warn threshold of [5000ms]
[2021-04-22T17:41:44,450][WARN ][o.e.t.OutboundHandler    ] [es03] sending transport message [MessageSerializer{Request{indices:data/write/bulk[s]}{3465036}{false}{false}{false}}] of size [1215] on [Netty4TcpChannel{localAddress=/[IP].157:37364, remoteAddress=[IP].156/[IP].156:9300, profile=default}] took [6714ms] which is above the warn threshold of [5000ms]
[2021-04-22T17:41:44,450][WARN ][o.e.t.OutboundHandler    ] [es03] sending transport message [MessageSerializer{Request{indices:data/write/bulk[s]}{3465039}{false}{false}{false}}] of size [1299] on [Netty4TcpChannel{localAddress=/[IP].157:37364, remoteAddress=[IP].156/[IP].156:9300, profile=default}] took [6714ms] which is above the warn threshold of [5000ms]
[2021-04-22T17:41:44,445][ERROR][o.e.b.ElasticsearchUncaughtExceptionHandler] [es03] fatal error in thread [Thread-11624], exiting
java.lang.OutOfMemoryError: Java heap space
        at org.elasticsearch.common.io.stream.StreamInput.readBytesReference(StreamInput.java:161) ~[elasticsearch-7.12.0.jar:7.12.0]
        at org.elasticsearch.common.io.stream.StreamInput.readBytesReference(StreamInput.java:127) ~[elasticsearch-7.12.0.jar:7.12.0]
        at org.elasticsearch.search.SearchHit.<init>(SearchHit.java:145) ~[elasticsearch-7.12.0.jar:7.12.0]
        at org.elasticsearch.search.SearchHits.<init>(SearchHits.java:84) ~[elasticsearch-7.12.0.jar:7.12.0]
        at org.elasticsearch.search.fetch.FetchSearchResult.<init>(FetchSearchResult.java:34) ~[elasticsearch-7.12.0.jar:7.12.0]
        at org.elasticsearch.search.fetch.QueryFetchSearchResult.<init>(QueryFetchSearchResult.java:28) ~[elasticsearch-7.12.0.jar:7.12.0]
        at org.elasticsearch.action.search.SearchTransportService$$Lambda$5799/0x0000000801948670.read(Unknown Source) ~[?:?]
        at org.elasticsearch.action.ActionListenerResponseHandler.read(ActionListenerResponseHandler.java:58) ~[elasticsearch-7.12.0.jar:7.12.0]
        at org.elasticsearch.action.ActionListenerResponseHandler.read(ActionListenerResponseHandler.java:25) ~[elasticsearch-7.12.0.jar:7.12.0]
        at org.elasticsearch.transport.TransportService$6.read(TransportService.java:755) ~[elasticsearch-7.12.0.jar:7.12.0]
        at org.elasticsearch.transport.TransportService$6.read(TransportService.java:735) ~[elasticsearch-7.12.0.jar:7.12.0]
        at org.elasticsearch.transport.TransportService$ContextRestoreResponseHandler.read(TransportService.java:1271) ~[elasticsearch-7.12.0.jar:7.12.0]
        at org.elasticsearch.transport.TransportService$ContextRestoreResponseHandler.read(TransportService.java:1258) ~[elasticsearch-7.12.0.jar:7.12.0]
        at org.elasticsearch.transport.InboundHandler.handleResponse(InboundHandler.java:264) ~[elasticsearch-7.12.0.jar:7.12.0]
        at org.elasticsearch.transport.InboundHandler.messageReceived(InboundHandler.java:128) ~[elasticsearch-7.12.0.jar:7.12.0]
        at org.elasticsearch.transport.InboundHandler.inboundMessage(InboundHandler.java:84) ~[elasticsearch-7.12.0.jar:7.12.0]
        at org.elasticsearch.transport.TcpTransport.inboundMessage(TcpTransport.java:690) ~[elasticsearch-7.12.0.jar:7.12.0]
        at org.elasticsearch.transport.netty4.Netty4MessageChannelHandler$$Lambda$5294/0x000000080176cf38.accept(Unknown Source) ~[?:?]
        at org.elasticsearch.transport.InboundPipeline.forwardFragments(InboundPipeline.java:131) ~[elasticsearch-7.12.0.jar:7.12.0]
        at org.elasticsearch.transport.InboundPipeline.doHandleBytes(InboundPipeline.java:106) ~[elasticsearch-7.12.0.jar:7.12.0]
        at org.elasticsearch.transport.InboundPipeline.handleBytes(InboundPipeline.java:71) ~[elasticsearch-7.12.0.jar:7.12.0]
        at org.elasticsearch.transport.netty4.Netty4MessageChannelHandler.channelRead(Netty4MessageChannelHandler.java:63) ~[?:?]
        at io.netty.channel.AbstractChannelHandlerContext.invokeChannelRead(AbstractChannelHandlerContext.java:379) ~[?:?]
        at io.netty.channel.AbstractChannelHandlerContext.invokeChannelRead(AbstractChannelHandlerContext.java:365) ~[?:?]
        at io.netty.channel.AbstractChannelHandlerContext.fireChannelRead(AbstractChannelHandlerContext.java:357) ~[?:?]
        at io.netty.handler.logging.LoggingHandler.channelRead(LoggingHandler.java:271) ~[?:?]
        at io.netty.channel.AbstractChannelHandlerContext.invokeChannelRead(AbstractChannelHandlerContext.java:379) ~[?:?]
        at io.netty.channel.AbstractChannelHandlerContext.invokeChannelRead(AbstractChannelHandlerContext.java:365) ~[?:?]
        at io.netty.channel.AbstractChannelHandlerContext.fireChannelRead(AbstractChannelHandlerContext.java:357) ~[?:?]
        at io.netty.channel.DefaultChannelPipeline$HeadContext.channelRead(DefaultChannelPipeline.java:1410) ~[?:?]
        at io.netty.channel.AbstractChannelHandlerContext.invokeChannelRead(AbstractChannelHandlerContext.java:379) ~[?:?]
at io.netty.channel.AbstractChannelHandlerContext.invokeChannelRead(AbstractChannelHandlerContext.java:365) ~[?:?]© 2020. All Rights Reserved - Elasticsearch
Apache, Apache Lucene, Apache Hadoop, Hadoop, HDFS and the yellow elephant logo are trademarks of the Apache Software Foundation in the United States and/or other countries.