How could we visualize an unique count grouped by bucket?
We understand that the counting will only check the uniqueness inside the bucket, but is it another way to achieve this?
Example: We want to visualize all the unique products a merchant has.
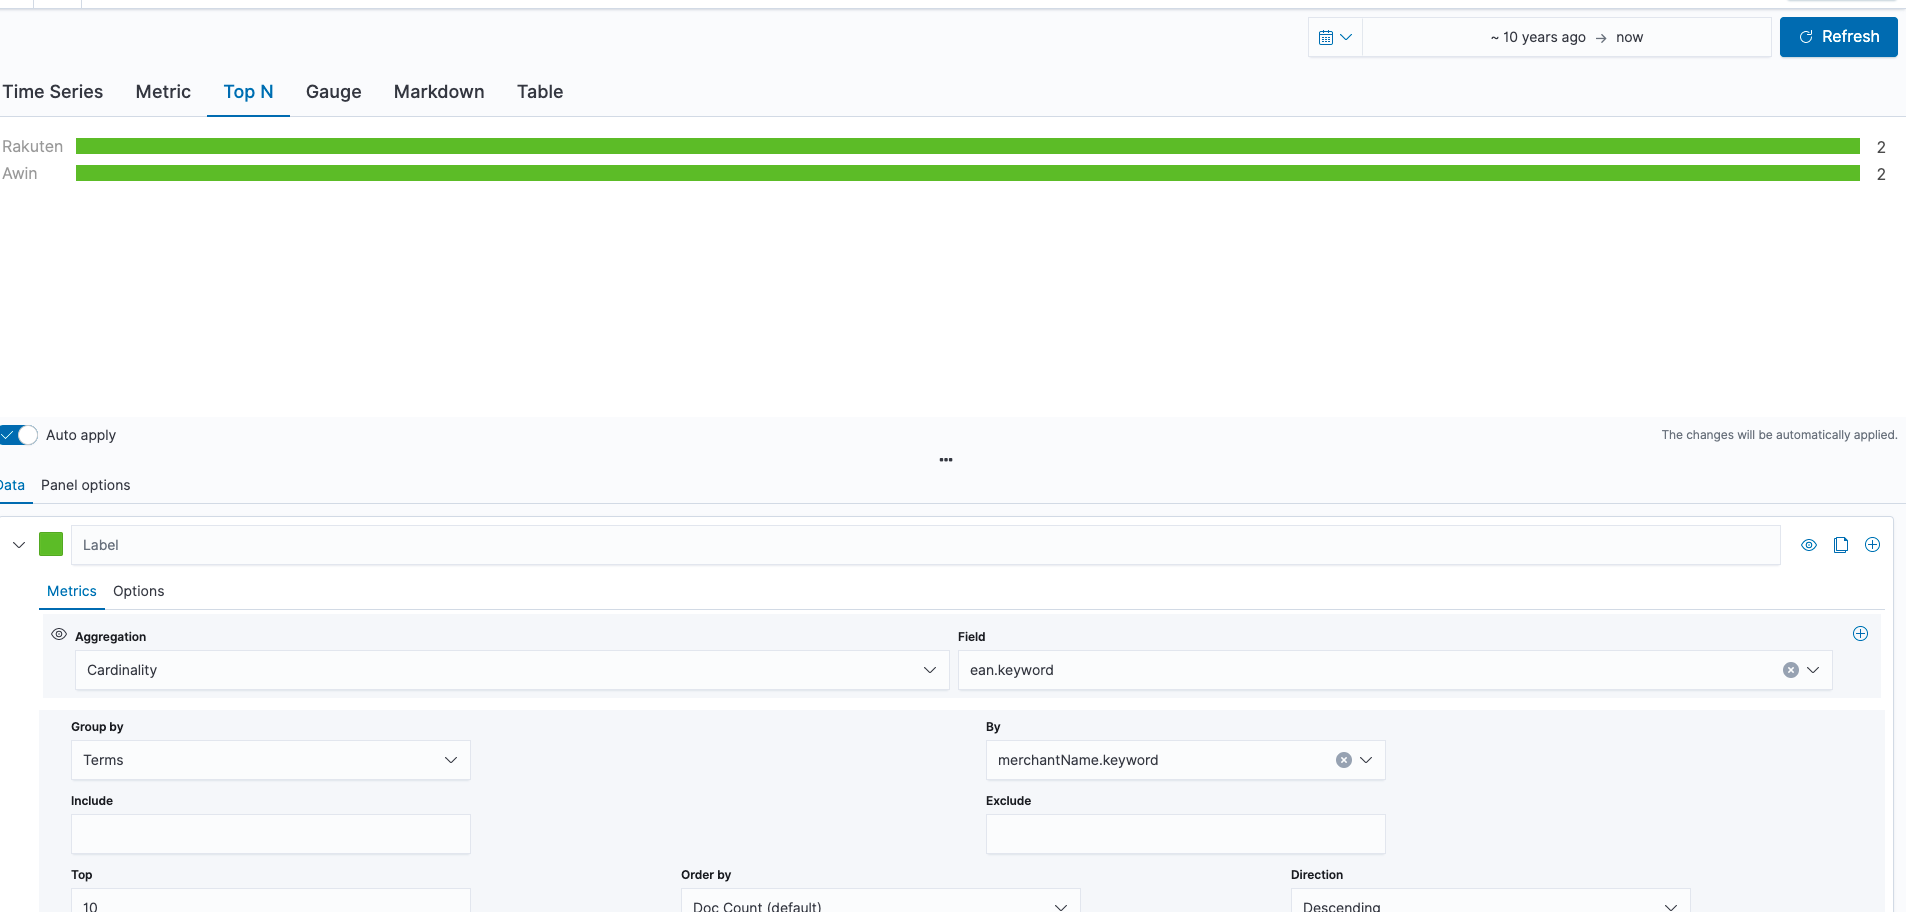
Hi @Razvan_Todea, If I understood you correctly, then I think I've achieved what you've asked using TSVB:
Here I visualized uniq count of destinations per each carrier (using sample data set):
Hi @dosant , thank you for the reply.
I've checked your example, but it seems that is not working as expected. As you can see in the pictures. We have a total of 5 products -> 3 products on merchant AWIN and 2 products on merchant Rakuten. But the ean: 1 appears in Rakuten and AWIN also (so is not unique). Instead of displaying that AWIN has 2 unique products, it should say that it only has 1 (the product with ean 3) and for Rakuten also 1 (the product with ean 2). The reasoning is that we want to know how many new products each merchant could get us.
What results you expect in case you have 3 merchants and 2 of them have a product and another doesn't?
In that case the product is not unique, so it should not be take into consideration for the count.
Merchant 1: product_ean: 1
Merchant 2: product_ean: 1
Merchant 3: product_ean: 2
The result should be:
Merchant 1: 0 unique products
Merchant 2: 0 unique products
Merchant 3: 1 unique products
Unfortunately, I didn't find a way how to achieve this in Kibana  Hope I didn't miss something obvious.
In case you'd find a way how to build such a complex aggregation with elasticsearch aggregations then you could try building custom Vega visualization for your custom aggregation.
© 2020. All Rights Reserved - Elasticsearch
Apache, Apache Lucene, Apache Hadoop, Hadoop, HDFS and the yellow elephant logo are trademarks of the Apache Software Foundation in the United States and/or other countries.