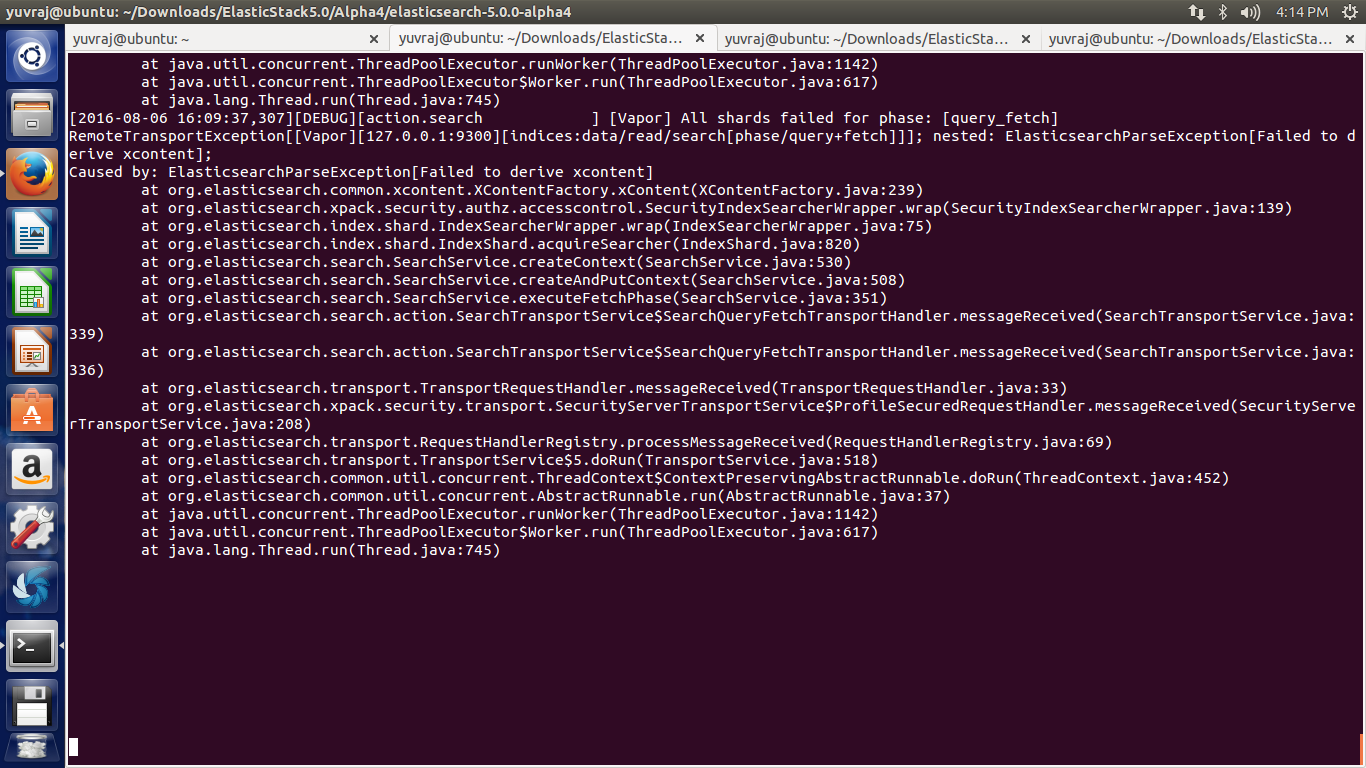
Upon opening Monitoring tab in Kibana, getting following error:-
Monitoring: Error 400 Bad Request: [parse_exception] Failed to derive xcontent
The error doesn't describe what went wrong and instead gives an error which isn't self explanatory. I am unsure what am i doing wrong which made me come across this error.
can you tell us which Elasticsearch version you are using, which kibana version and check kibana/elasticsearch logs for exceptions, include those here as well as maybe provide a screenshot where exactly this happens?
Really sorry for such a late reply.
Yes as you mentioned it's a generic error message.
Can we have a specific error message displayed instead of generic error message?
It will be more useful to the user to understand it easily.
I create a role as shown above and associated the role with a new user.
Upon opening Kibana and logging via the new user, I was unable to view any indices or information in either of Discover, Visualize or Dashboard Page. It was showing me a blank page.
For this I am seeing an error of Failed to derive x-content.
The error is not useful at all for an end-user to understand what wrong is he doing.
I tried to reproduce based on your steps and I did not encounter such error messages.
I created a testing user and associated that user with a testing role as you shown above with access to all indices and clusters. Then I logged in as a testing user and I was able to see what was in discover using * index pattern and the monitoring tab contents.
I am also unable to reproduce it every time, but few times it occurs and provides a generic error.
If possible you can replace the generic error with specific errors for the same.
Apache, Apache Lucene, Apache Hadoop, Hadoop, HDFS and the yellow elephant
logo are trademarks of the
Apache Software Foundation
in the United States and/or other countries.