I was wondering how to make a Timelion visualisation for PostgreSQL stats. I was able to config Metricbeat module and collect data, it is sending data every 30s.
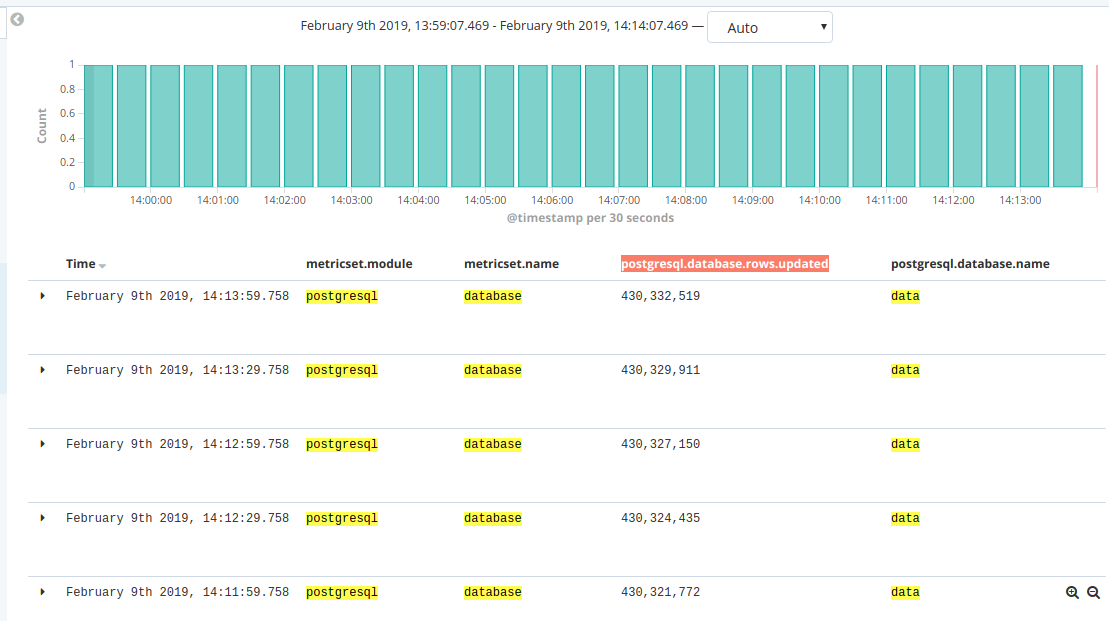
How can I draw the delta of the field "postgresql.database.rows.updated" as this field shows the total count of updated rows (and not the real progress). I want to show the different values occurring during the process (in my case every 30 seconds).
That will always subtract the value of 30s before from the current value and thus you only see the change. I stripped out unnecessary things in that expression, so you might need to make sure your working on the right index and timefield.
Apache, Apache Lucene, Apache Hadoop, Hadoop, HDFS and the yellow elephant
logo are trademarks of the
Apache Software Foundation
in the United States and/or other countries.