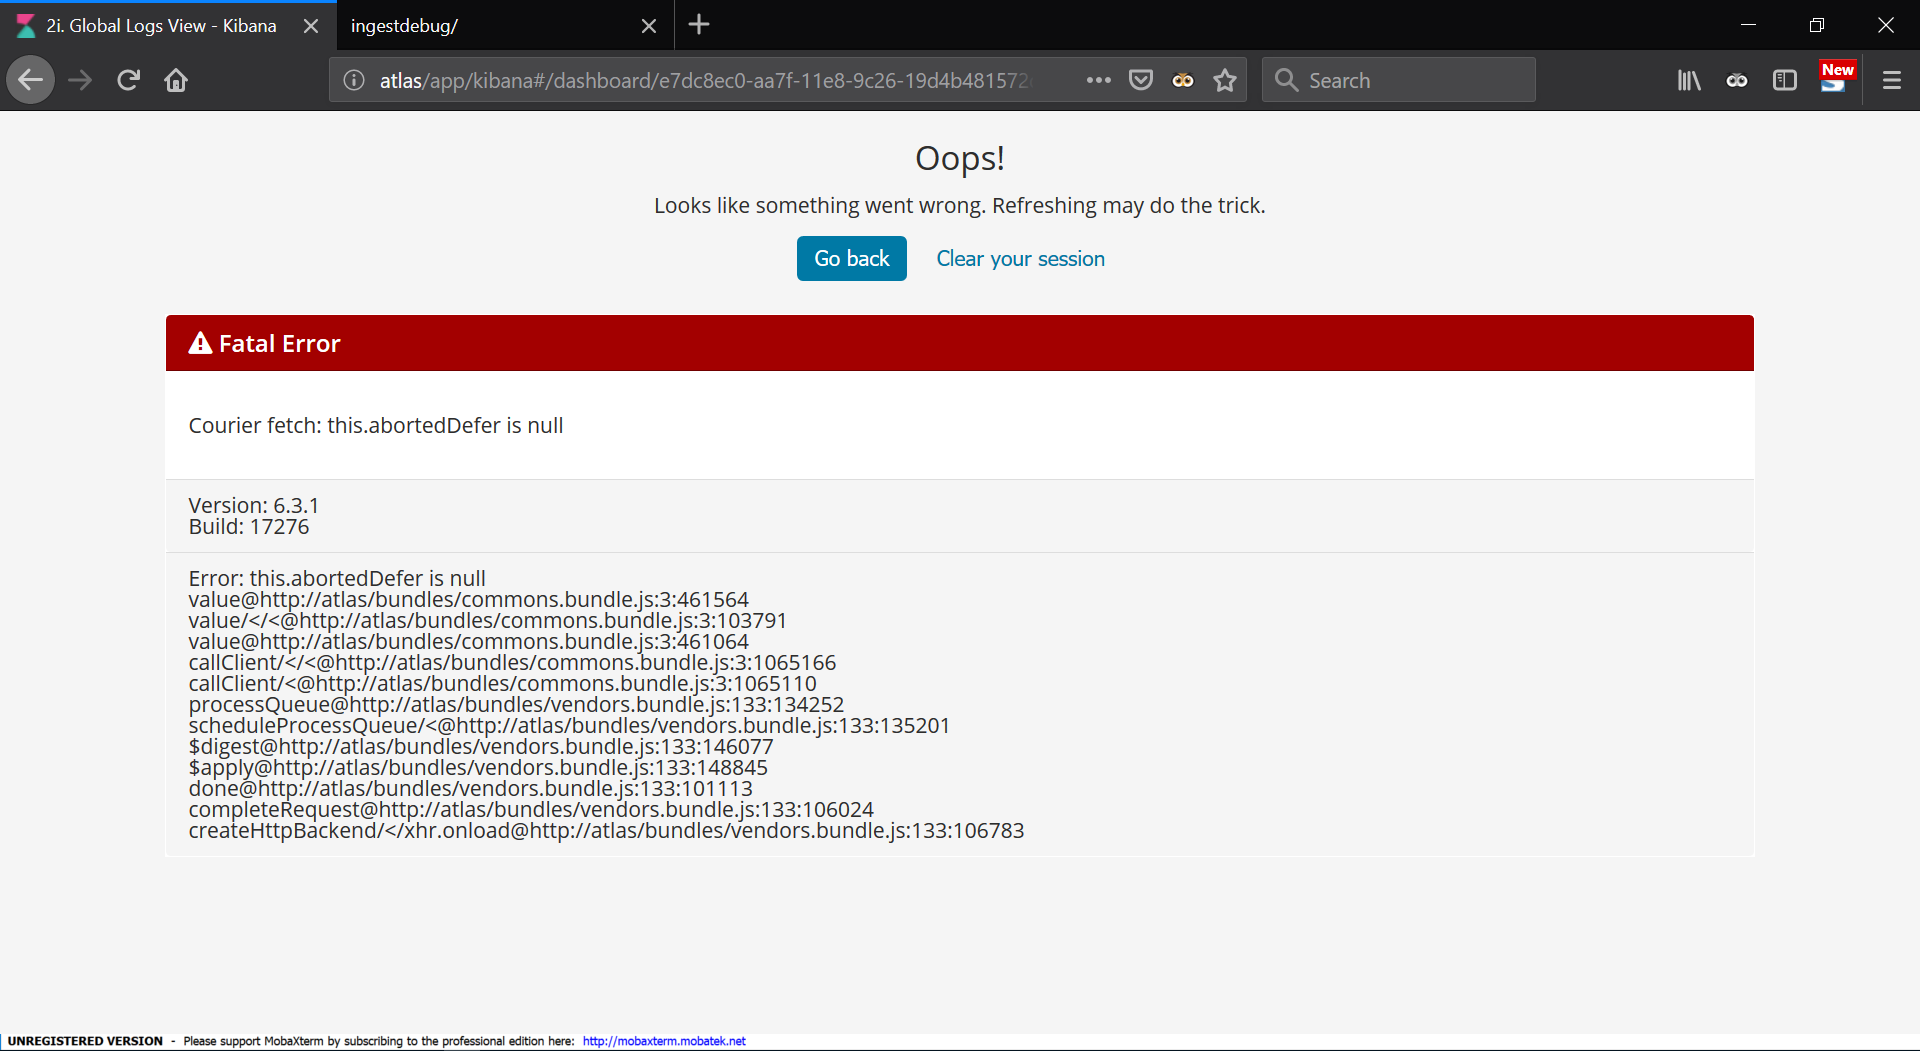
I am using ELK 6.3.1 and off late I have started getting below errors when I try to load any dashboard (including discover) for a relatively longer time span.
Sometimes I get this error as well.
The only error I see is in Kibana logs that indicate socket hang up.
{"type":"log","@timestamp":"2018-11-21T13:17:03Z","tags":["error","elasticsearch","data"],"pid":1,"message":"Request error, retrying\nPOST http://10.193.104.42:9200/_msearch => socket hang up"}
I checked the usual stats (cpu/memory/disk usage) and they all look OK.
After I restarted the nodes, it looked like the problem was solved but it soon appeared. I then deleted some old data and since then it is almost working well. (Able to search last 1 year in Discover but not able to load a dashboard that has some heavy aggregations)
Any idea, what I should check? Let me know what other information you may need. Thank You.
You may want to increase the elasticsearch.requestTimeout setting in kibana.yml.
However, you should also be aware that aggregations over big data sets and long timespans are potentially very resource intensive and can lead to out-of-memory situations in addition to taking a long time.
The Rollup APIs were created to address some of these issues, and since Kibana 6.5 rollup visualisations are now also (partially) supported.
What is the output of the cluster health API?
I have already increased that to 600 seconds. I'll be moving to 6.5 as soon as compatible versions of the plugins are available. So i'll give rollup APIs a try. Yes, I understand that and I am mindful of the fact that my setup is relatively low-power (one 64 GB server running two docker instances with 16 gb reserved mem for each instance) and another 16 GB server running client + kibana. I just want to root-cause the issue since the current errors shown are not sufficient. Moreover the behavior is slightly unpredictable. The same data set + span works at times and other times even a reduced set throws error.
If I can see the proof that OOM has occurred or CPU is maxing out, then I can know that is the problem. Thanks.
Green.
{
"cluster_name": "es-staging-cluster",
"status": "green",
"timed_out": false,
"number_of_nodes": 6,
"number_of_data_nodes": 2,
"active_primary_shards": 72,
"active_shards": 144,
"relocating_shards": 0,
"initializing_shards": 0,
"unassigned_shards": 0,
"delayed_unassigned_shards": 0,
"number_of_pending_tasks": 0,
"number_of_in_flight_fetch": 0,
"task_max_waiting_in_queue_millis": 0,
"active_shards_percent_as_number": 100
}
BTW, why does it say "Bad Gateway"? Only because the socket is in a stuck state?
The HTTP response code 502 (Bad Gateway) is usually generated by a proxy. Do you access Elasticsearch or Kibana via a proxy by any chance? If this is the case, you may want to increase the timeout the proxy uses to keep connections open.
No, I am not using any proxy.